


By Alan Reynolds
Core inflation is the key to understanding the current economy and should guide the Fed’s actions. Instead, the Fed follows core inflation with a lag, or just ignores it and fights high employment, the Michigan survey, and/or oil prices. The Fed’s preference for fine-tuning the economy causes economic problems.
The whole idea of “core” inflation seems phony to most people – a poor excuse to make high inflation look better. How could anyone possibly leave costs of food and energy out of inflation measures? Don’t people have to eat and drive?
This objection is understandable and also correct for most purposes. Yet too broad a measure of inflation can be misleading and too ambitious when Federal Reserve officials allude to that statistic as a target and a rationale for manipulating key interest rates.
The trouble is that any “all‐items” index of consumer prices will frequently exaggerate the typical or “underlying” trend of inflation – typically by being dominated by extreme swings up and down in global prices of energy and food commodities. This can make apparent “headline” inflation over the past 12 months dangerously misleading as a guide to future policy for the next 12 months.
The first graph below compares year‐to‐year changes in the all‐items PCE index (for personal consumption expenditures) with two alternative measures of the less‐volatile core inflation rate. One is the Fed’s preferred Core PCE index from the Bureau of Economic Analysis (BEA). The other is the Trimmed‐Mean PCE index from the Federal Reserve Bank of Dallas. The Trimmed‐Mean index excludes the most extreme price increases and decreases to focus on more typical and less volatile price changes.
In the consumer price index (CPI), for example, airline fares rose 12.9% in May and fell 2.5% in June, though neither number could possibly indicate a trend. The Core CPI includes airline fares and other public transportation as “services less energy” despite their evident connection with global oil prices. But such big monthly swings in airline fares (or anything else) are excluded from the Trimmed‐Mean PCE inflation as too volatile to be meaningful. Prices of dental services rose 1.9% in June after falling in April, which might also be too volatile and abnormal to be included.
The note uses two graphs to illustrate the practical necessity of focusing on trimmed‐mean or core PCE inflation for timing Federal Open Market Committee (FOMC) decisions to raise and lower the federal funds rate (The FOMC has never raised the fed funds rate without lowering it before long). I plan to write a follow‐up, offering more charts adding variables that seem to better explain past federal fund rate cycles more clearly than core inflation – namely, employment or unemployment rates and crude oil prices.
The first graph begins with June 1983 and ends with May 2022 because this has been a period of relatively moderate core inflation compared with 1973–82. Specifically: Core inflation as measured by the Trimmed‐Mean never exceeded 4% since June 1983 and never fell below 1.5%.
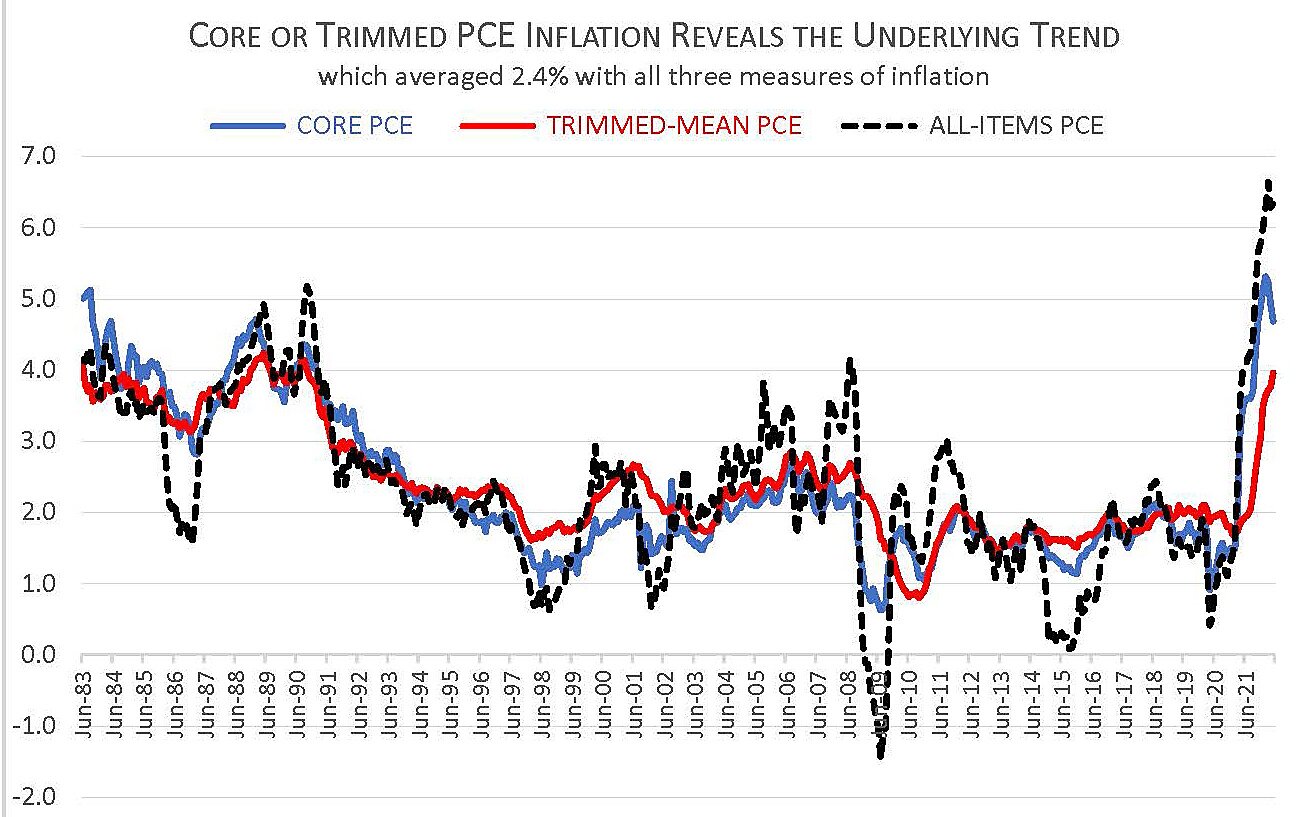
The most important thing to understand is that the long‐run average of core or trimmed inflation is no lower than it is for the all‐items PCE index. Since mid‐1983, all three measures averaged the same 2.4% a year. A proper core price index does not make inflation look lower over time – only less erratic.
As the black line shows, the all‐items measure of inflation did not just rise much higher than core measures half a dozen times (when oil prices spiked), it also fell much lower than core inflation in the following year or longer.
The trimmed‐mean and PCE core inflation rates iron‐out ephemeral peaks and valleys in headline inflation, leaving multi‐year averages the same. That is what is meant by using core inflation to reveal the “underlying trend” – which was 2.4% for the last 39 years and most likely for future years as well (since it is such a well‐established trend).
The second graph reaches back to 1978. It compares a smoothed 12‐month trend of the Trimmed‐Mean PCE inflation (the blue line) with the federal funds rate (in red) on the last of those twelve months.
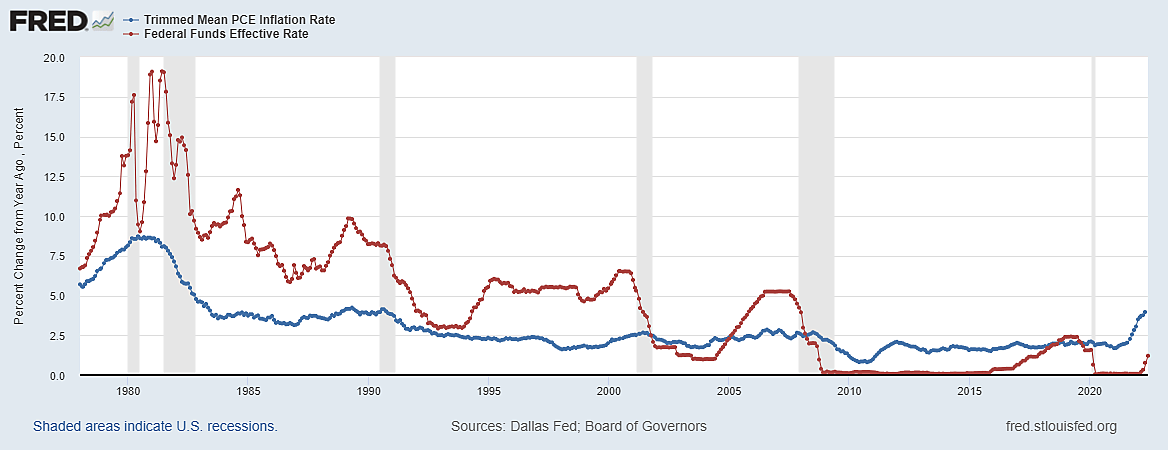
Because each month’s inflation average includes 12 months, Federal Reserve officials knew whether core inflation had been speeding‐up or slowing for about a year whenever they raised or lowered the federal funds rate (the core CPI was first reported in 1978).
If the most dramatic of many changes in the federal funds rate had been in response to previous ups and downs in core inflation, then we would expect to see the red line peak before the blue line began slowing down instead of years later as it did in 1981–84. Also, we would not expect the federal funds rate begin to fall before 12‐month core inflation had slowed, as it did in 1980, 1989, 2000 2008 and 2019.
The six rises and falls of the federal funds rate in second graph do not look like reactions to significant changes in core inflation. They look more like ineffective attempts at cyclical fine tuning. That is, the fed funds rate always rose before all recessions – even if core inflation was flat or falling. And the funds rate subsequently fell more quickly than core inflation during all recessions except one (February to June 1982).
The measures of core inflation in these graphs are based on the PCE index rather than the CPI. The CPI suffers from fixed weights, which means the relative importance of items does not change with consumer behavior (gasoline remains just as important if people switch to telecommuting or EVs). The Core CPI is also too heavily dominated by lagging estimates of housing rents and rental equivalence which report last years’ contracts as this year’s inflation. And it includes airline fares among non‐energy prices though they are obviously affected by fuel costs.
The only comparative disadvantage of PCE inflation is that it comes out long after the CPI and, unfortunately, a few days after the next FOMC decision on interest rates.
Trimmed‐Mean PCE inflation was 4% on a year‐to‐year basis in May, and PCE core inflation likewise rose at a 4% annual rate from February to May. That may sound low, but it is nearly double the average since June 1983. Trimmed‐mean PCE inflation can and should be reduced to 2%, as the Fed suggests.
Much of what is included in core inflation reflects domestic markets and is therefore potentially affected by domestic financial conditions. The all‐items CPI, by contrast, is mostly global and therefore dominated by foreign events like war and sanctions.
In May, the average 12‐month CPI inflation was 8.8% in the EU and 9.6% for 28 countries in the OECD. The Fed did not cause that global infection and cannot cure it. Most of core inflation, by contrast, is home-grown. Improved supply incentives and restrained growth of spending should be able to cut 4% core inflation in half without much problem, as we did from mid‐1983 to 1998 with only a brief recession related to the Gulf War and (as always) a higher fed funds rate.
Originally published by the Cato Institute. Republished with author’s permission.
For more great content from Budget & Tax News.
More articles on inflation.
For more from The Heartland Institute.
This work is licensed under a Creative Commons Attribution-NonCommercial-ShareAlike 4.0 International License.


")

