

")
Congress has been busy doing great damage to the economy lately. The passage of the Chips for America Act and Reduce Inflation Act will impact the economy for years to come. This monthly economic update incorporates the negative impact of recent legislation and its impact on growth, living standards, and financial markets.
The Biden administration and Congress have taken a major step to move economic policies away from classical economic principles. The Inflation Reduction Act should be called the Reduce Living Standards Act. Along with last month’s Chips for America Act, the bills shift control of about $100 billion a year from the private, productive economy to the nonproductive government sector.
These acts complete a series of moves that reduced economic freedom by shifting power and resources to government.
The first effort was the government lockdown in 2020 and the $2 trillion increase in spending to prop up the economy. In November 2021, as the economy soared, the Build Back Better legislation imposed $100 billion a year for the next decade in increased federal spending and taxes. The legislation killed the recovery.
A detailed economic analysis of the cost of the Reduce Living Standards Act indicates its perverse incentives on employment and investment can reduce GDP growth by 1.2 percent per year. Although we all hope for minimal damage, history indicates we should prepare for an extended period of lower living standards.
My book, Rich Nation, Poor Nation, provides details on how five previous rapid increases in federal spending and taxes crippled the US economy and caused living standard to stop increasing. The latest moves in this direction will do the same.
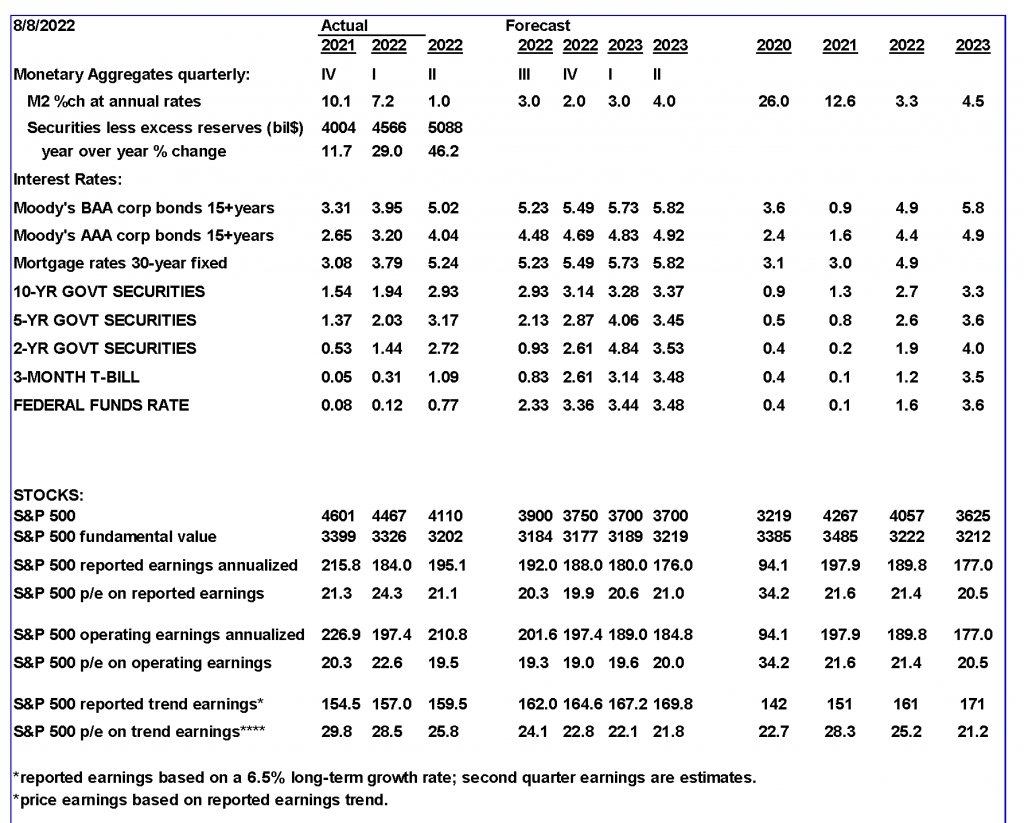
The Congressional Budget Office (CBO) is forecasting the economy will grow by 2 percent a year over the next 10 years. The forecast assumes increases in productivity of 1.5 percent a year and labor force growth of 0.05 percent a year.
As with many forecasters, the CBO ignores the perversely destructive impact of government policies. History shows how giving more power and control to government weakens the private sector. The policy shift from Build Back Better has already produced sharp declines in productivity and living standards. Additional disincentives to work from the latest laws will reduce labor force participation and further damage growth.
By ignoring the impact of government policies, most forecasts failed to anticipate the recent deterioration in America’s productivity, which declined by 3 percent following enactment of Build Back Better.
The recent additional policy changes make it likely the economy will not grow in the years immediately ahead. Living standards will continue to fall.
If the nation’s longer-term growth trend is close to zero or below that, the implication for the immediate future is not good. As the Fed continues its attempts to restrain demand, output will decline. The magnitude of the decline remains speculative, though it will take a sharp decline in inflation to avoid a serious downturn in business activity.
The type of vigorous growth in living standards Americans have come to expect will end until there is a major change back to free-market classical principles. Governments cannot produce prosperity. Only the private sector can produce prosperity. Too often, the only thing governments produce is chaos.
Monetary Indicators
As the Fed tries to contain inflation, monetary indicators are mixed but shifting toward restraint.
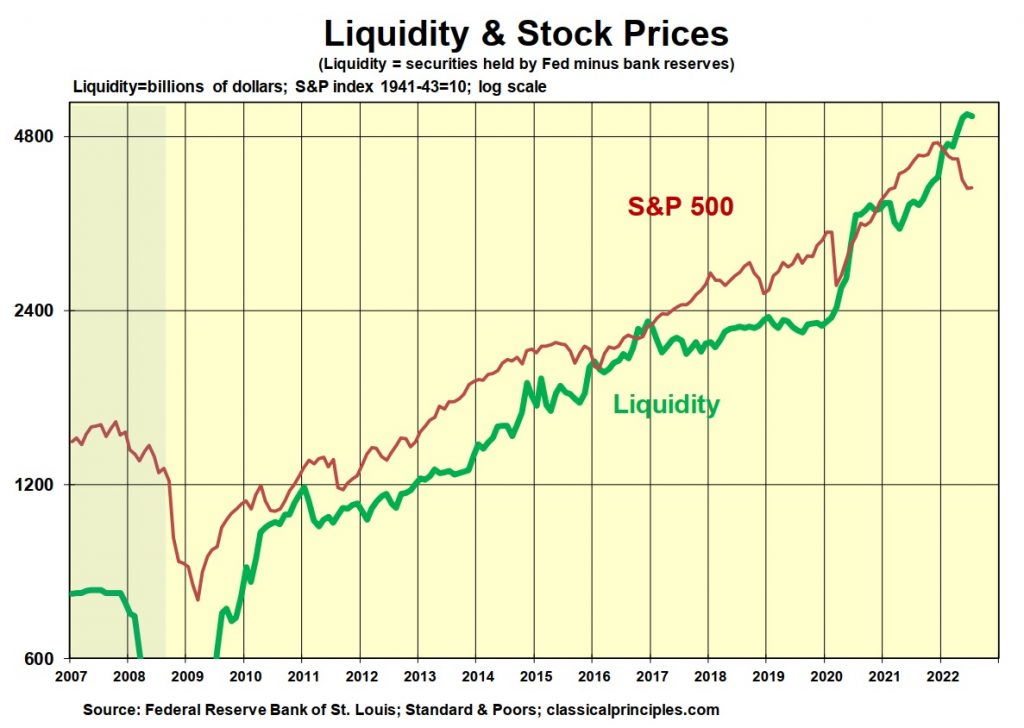
My analysis of the amount of money going into the economy tracks both the Fed’s purchases of securities and bank reserves (deposits banks hold at the Fed). Purchases of securities minus bank reserves provides liquidity to the economy.
The Fed intended to sell $47.5 billion of securities in June, July, and August. It sold only $3.6 billion in June and $21.7 billion in July.
However, in June banks shifted $89.5 billion in deposits with the Fed into loans and investments in the economy, boosting liquidity. The net effect for June was to increase the amount of liquid assets by $86 billion.
In July, banks increased their deposits with the Fed by $22.6 billion. The net effect including the Fed’s $21.7 billion in sales was a decline of $44 billion in liquidity. By this measure there has been no significant monetary restraint. The green line in the following chart shows the slight decline in July.
Monetary policy doesn’t occur in a vacuum. When monetary policy changes, there tend to be reverberations through the financial markets. It’s often helpful to look at a number of financial indicators in an attempt to determine the impact of money on the economy.
One unique aspect of the Fed’s current policy is that it has changed its procedures. The Fed has been providing a detailed plan for how it intends to contain inflation. Although it has not followed its own plan with respect to selling securities, the Fed has followed it in terms of interest rates.
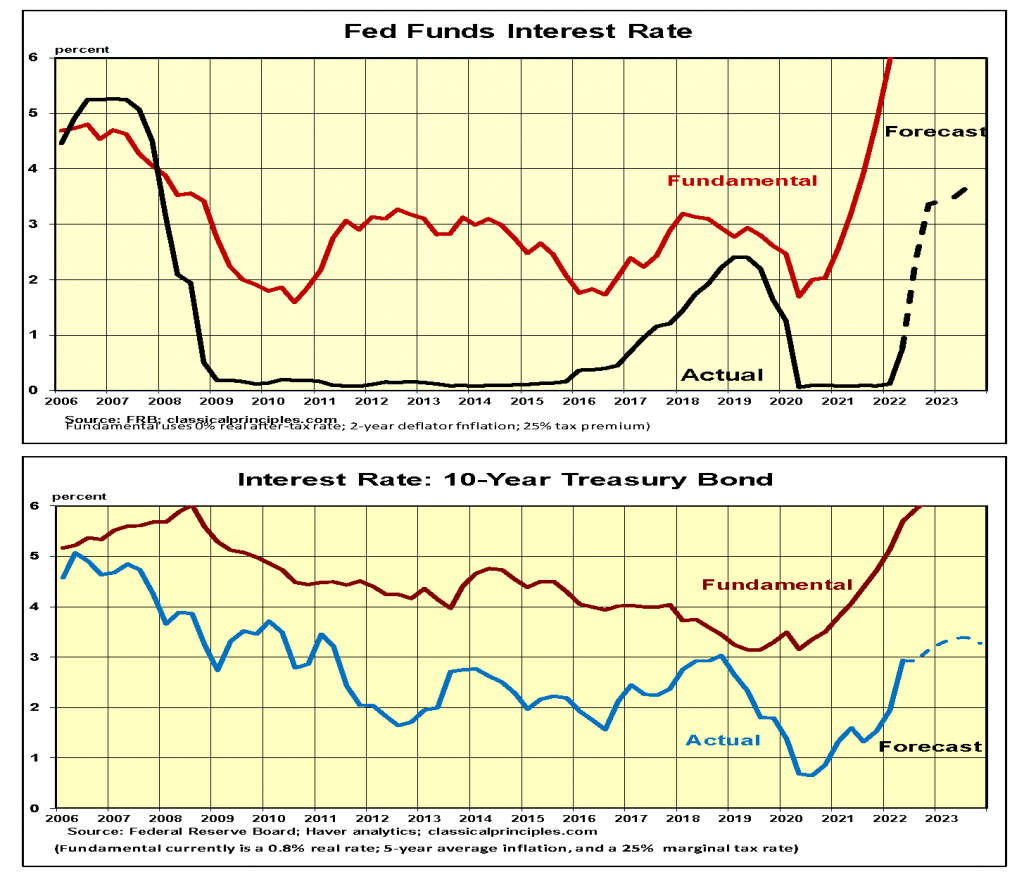
In recent months the Fed has increased its target fed funds rate by the most in over 40 years. Since March, the fed funds rate went from essentially 0 percent to 2.3 percent. Currently, financial markets anticipate a 0.75 percent increase next month, bringing the rate to just over 3 percent.
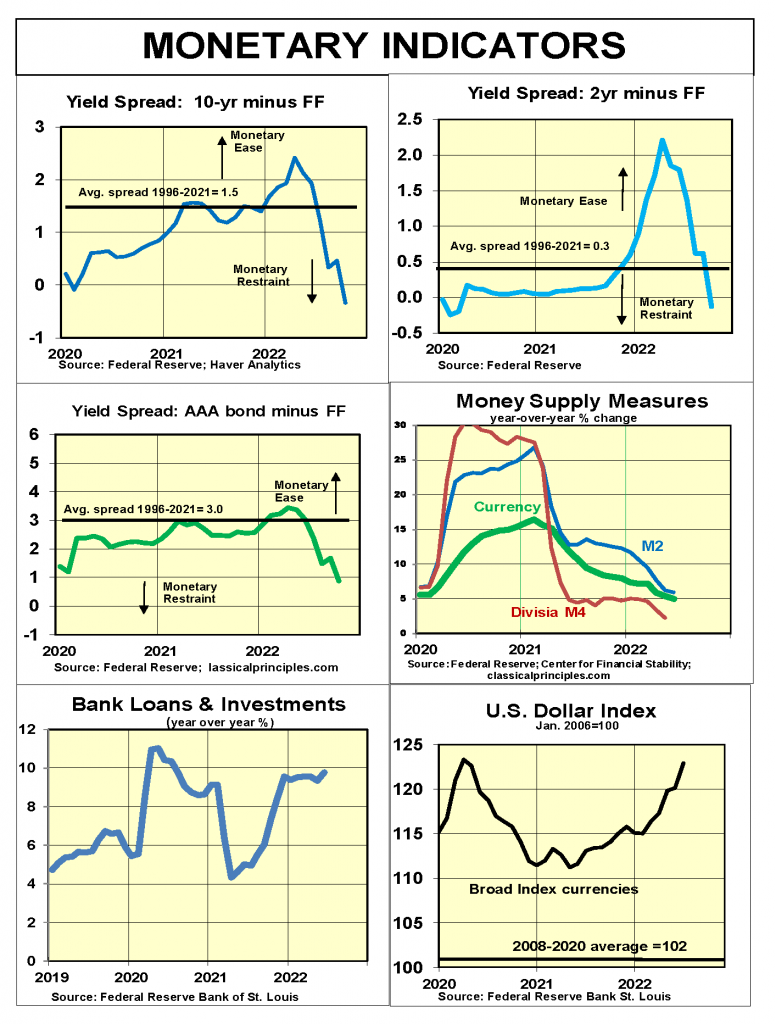
In response to the Fed’s intent, financial markets have responded as might be expected if monetary policy had turned restrictive.
The yield curves in the following illustration have been updated through October. The future interest rates are based on the market’s expectation of a 3.1 percent fed funds rate in October along with current market interest rates for other securities. With these adjustments, yield curves point to a highly restrictive monetary policy.
The charts show various more traditional measures of the money supply are also pointing to restraint.
Hence, in spite of the liquidity measure showing more than enough money in the economy, the preponderance of other signs points to monetary restraint.
Sensitive Indicators
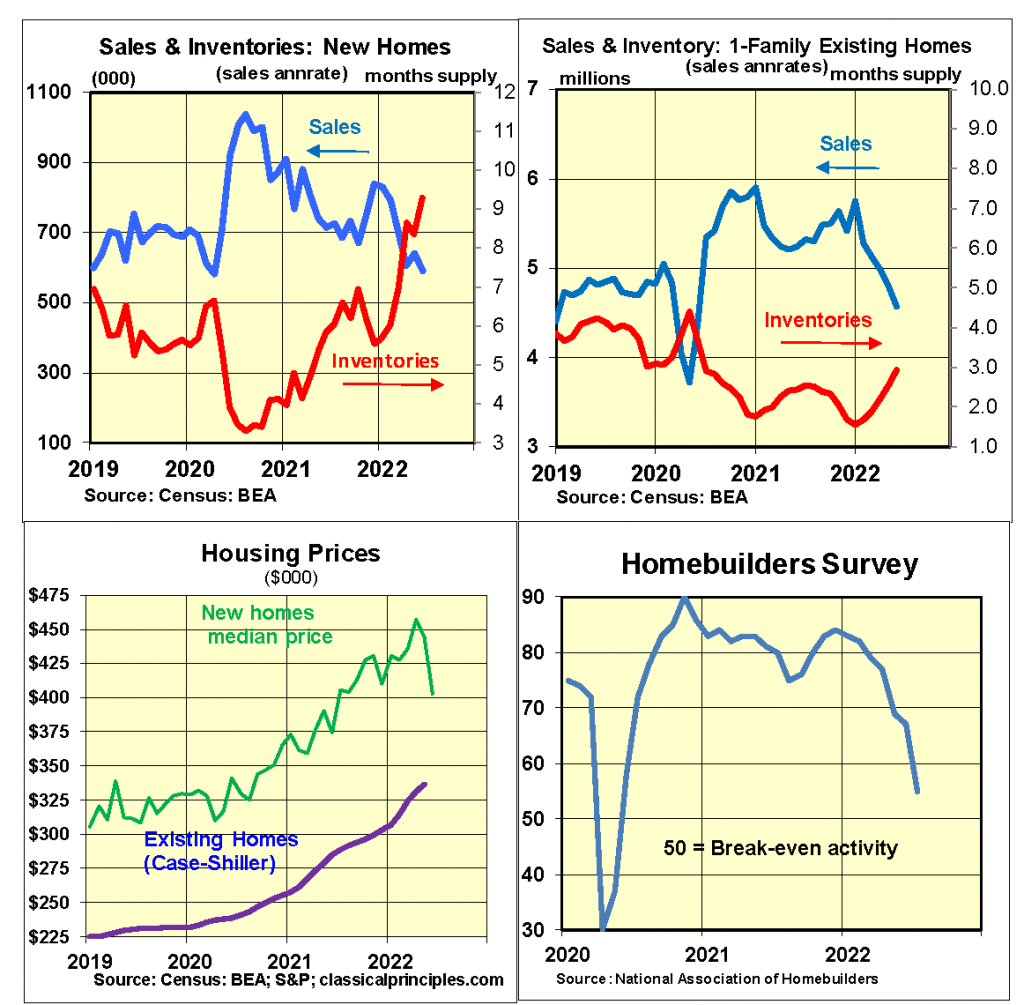
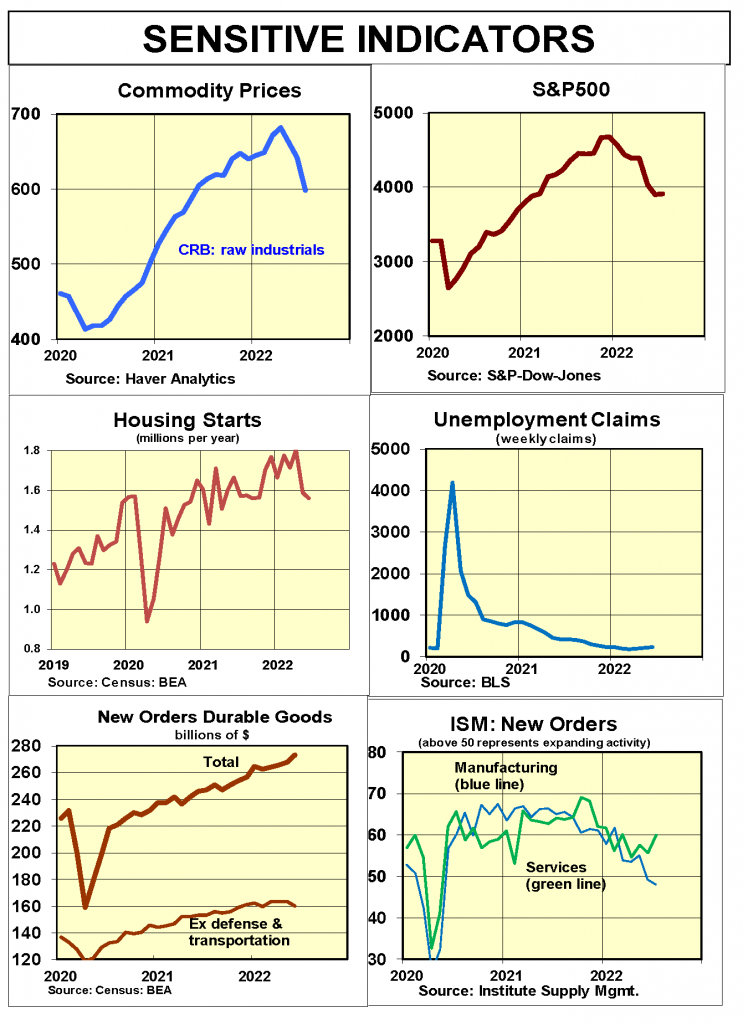
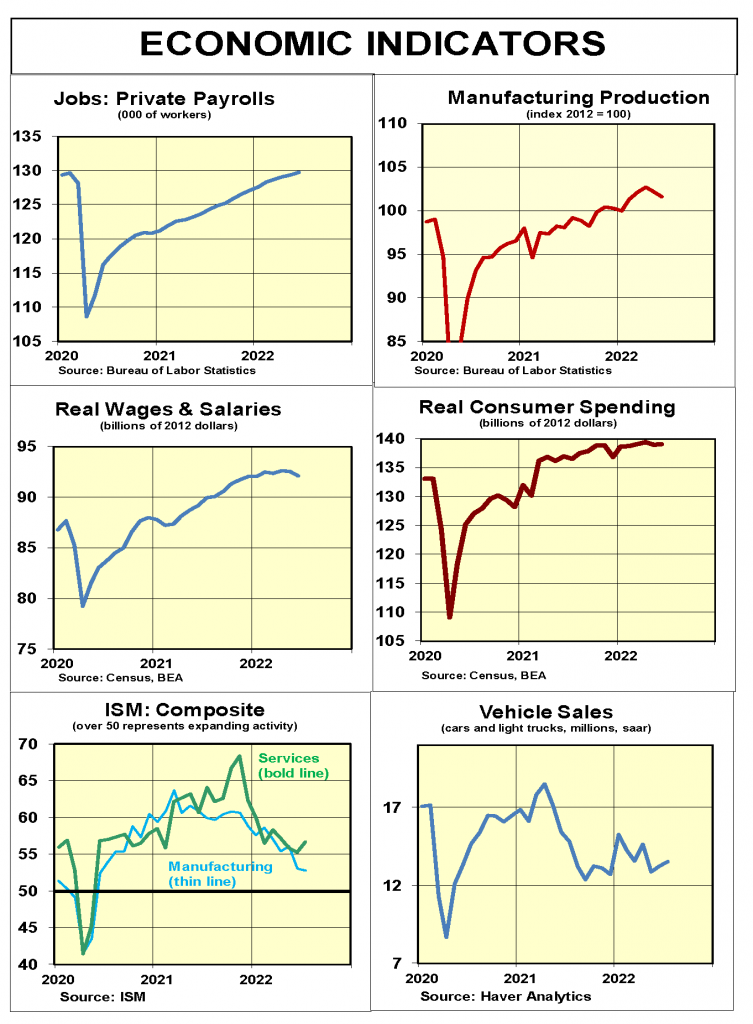
Sensitive short-term indicators have turned negative. Two of the most reliable—stocks and housing—already have pointed to a downturn. Most sensitive indicators for July point to an emerging downturn. Commodity prices, manufacturing new orders, and the Homebuilders’ survey all extended previous declines. In spite of a strong jobs report for July, initial unemployment claims are increasing.
Higher mortgage interest rates and soaring home prices led to a sharp decline in existing home sales through June. June new home sales also extended their decline amid a sharp increase in inventories of new homes.
Coincident indicators remain mixed, but more show signs of leveling off or moving lower. Job growth is the only coincident indicator with an upward trend through July. High inflation rates have brought real growth to an end.
Inflation Indicators
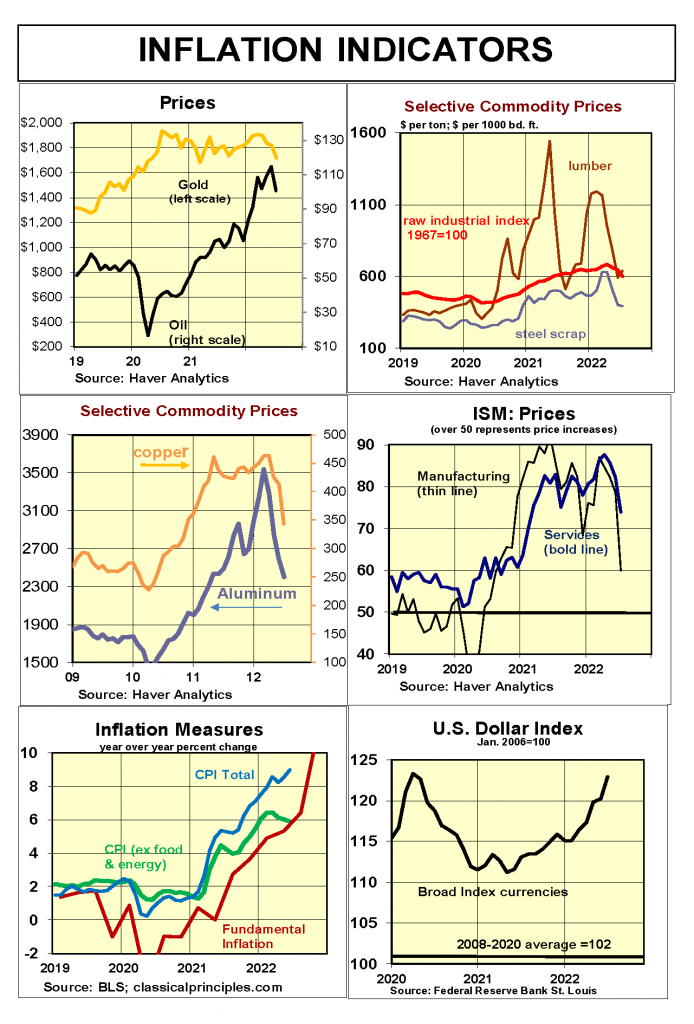
Commodity prices, including oil, show signs of easing. Most sensitive commodity prices continued to decline through July. These sensitive inflation indicators point to a likely slowdown in demand. If so, it should provide some relief from recent very high inflation rates.
Business surveys show an ongoing moderation in price increases for their purchases. The signs of some easing in inflation are due to a moderation in demand—the economy slowing down.
Current dollar spending (GDP) was up at a 7 percent rate in the first half of 2022. This compares to a 12 percent increase for all of 2021. For the three months ending in June, personal spending, incomes, and wages have increased at close to a 7 percent annual rate.
Our analysis of money shows rapid increases in interest rates, such as the Fed is currently using, can reduce the rate of spending and demand in the economy to the 5 percent to 6 percent vicinity in the last half of this year.
Financial markets are assuming the Fed will be able to contain inflation quickly. Although we hope this will occur, without strong increases in productivity it will likely take at least a year, or a sharp drop in demand, to achieve a significant near-term reduction in inflation.
Interest Rates
Financial markets are beginning to believe the Fed is serious about containing inflation. In addition, several monetary indicators are pointing to monetary restraint.
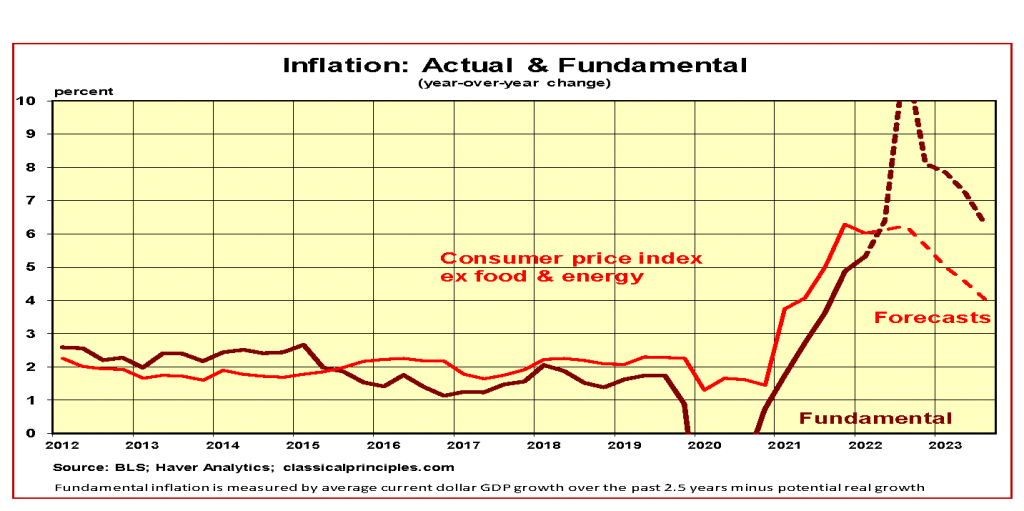
Our forecast assumes there is sufficient restraint to slow the pace of current dollar spending (GDP) to the 5 percent to 6 percent vicinity in the last half of this year. We also assume the rate of inflation remains in the 6 percent vicinity in the last half of the year.
Although we anticipate a further slowdown in spending in 2023, a persistent 4 percent to 5 percent inflation rate would mean the Fed will impose further increases in interest rates. While the magnitude of both inflation and the downturn in the economy remain speculative, for the moment the Fed appears on track to act decisively to contain inflation.
Stock Prices
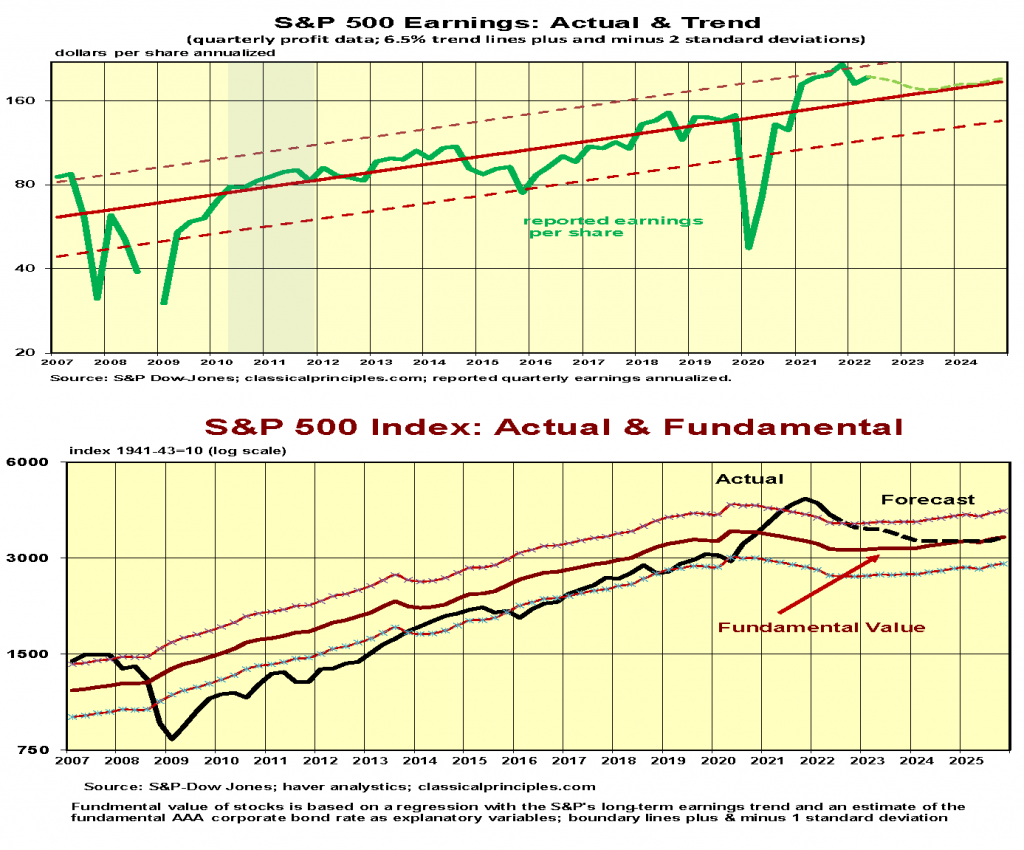
With 85 percent of the S&P500 companies reporting, second quarter reported earnings are up only 1 percent from a year ago. The chart below shows second-quarter earnings are 25 percent above their long-term underlying trend. Since there is a strong tendency for profits to return to this trend, our forecast shows a downward trend in S&P500 earnings over the next year or two.
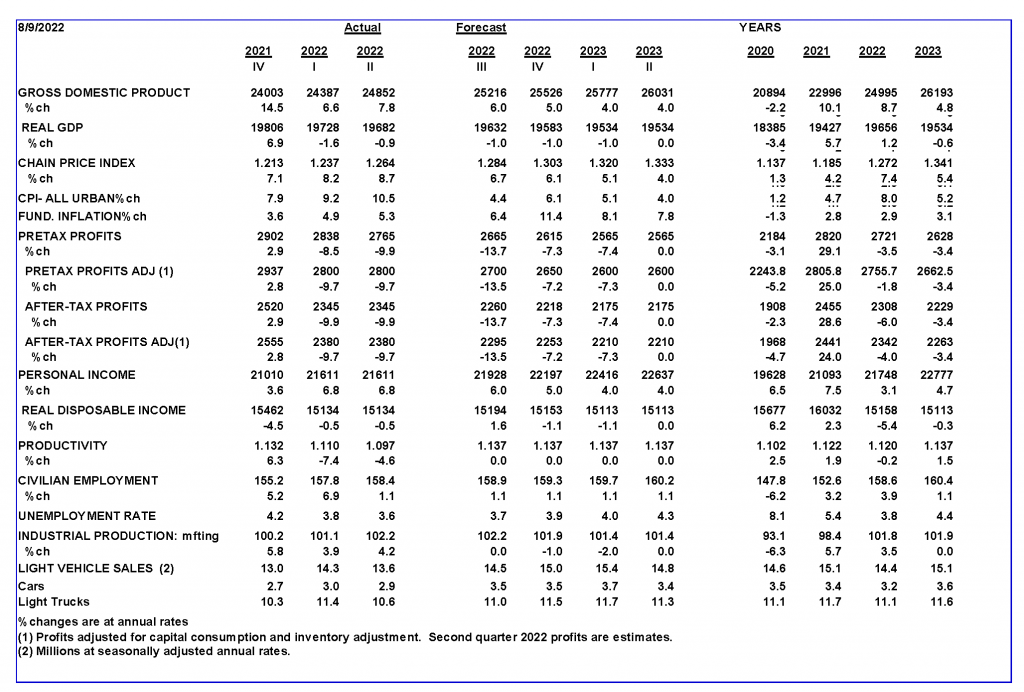
Since earnings are generally unpredictable, our stock market mode uses the S&P500 longer-term earnings as a key guide to the underlying value of the S&P. The second variable in our stock market model is the underlying Moody’s AAA bond rate.
Our assumption of a higher than actual bond rate reduces our estimate of the S&P500 fundamental value to 3,200, putting the S&P500 25 percent or more above its fundamental value.
An alternative model using current interest rates instead of our estimate of a higher bond rate values the S&P500 close to 3,900. If the Fed is able to keep longer-term interest rates at current levels, it means the S&P500 is only slightly above its underlying value.
Recent economic policy changes provide for a more difficult environment for the economy. As a result, we continue to believe the period ahead will be difficult for stocks.
Read Robert Genetski’s weekly economic analysis column every Friday at Heartland Daily News, and catch up with past columns here.
For more great content from Budget & Tax News.
For more from The Heartland Institute.


")

