


At least two more years of economic productivity decline and lower living standards are likely without a major change in federal economic policy.
The one sure thing the midterm elections indicate is Americans remain as deeply divided as ever. As a result, there will be little shift in political power that affects economic policies.
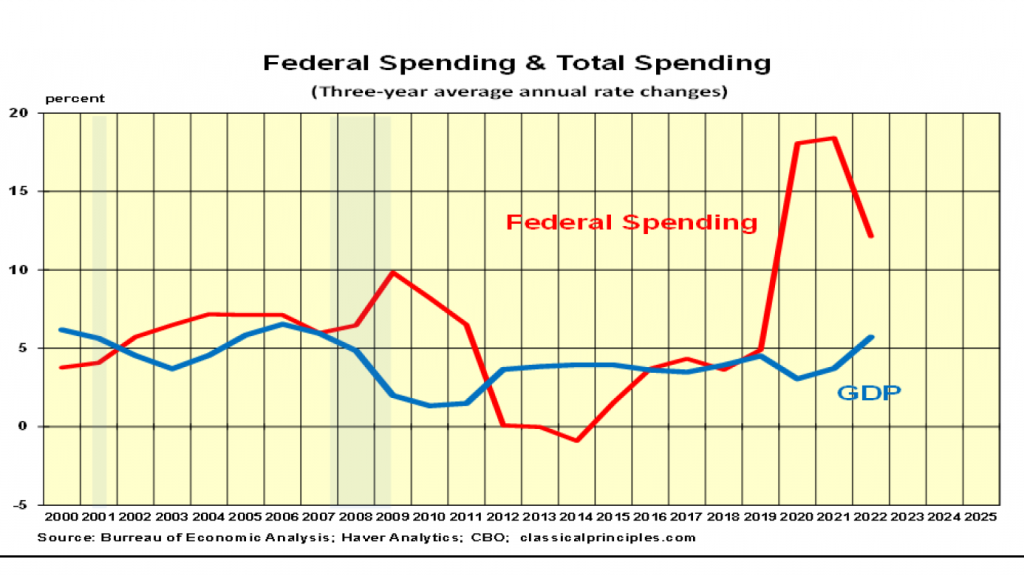
Historically, moves toward and away from free-market classical policies have created alternating cycles of prosperity and economic hardship. The recent shift away from prosperity began in 2020 with the government lockdowns and soaring federal spending and regulation.
Economic policies in 2021 and 2022 continued the move toward so-called “progressive” policies. This is the sixth time since 1900 that policies have moved this way, each having the same result: the economy weakens, and living standards decline.
Government spending from 2019 to 2022 rose 12 percent a year, twice the 6 percent a year annual increase seen for the overall economy. When government increases its control over resources, individuals have less control and less freedom. This combination undermines productivity.
Without a major change in economic policy, it will be nearly impossible to restore the economy’s productivity and reverse the decline in living standards for at least the next two years. Historically, a major policy change occurs only after there is either a clear understanding of what is needed to restore growth, or the economic pain becomes too great to bear. The midterm election results indicate neither of these conditions has occurred.
Monetary Indicators
Monetary policy indicators are signaling more monetary restraint. One aspect of the current restraint is how long it took the Fed to act.
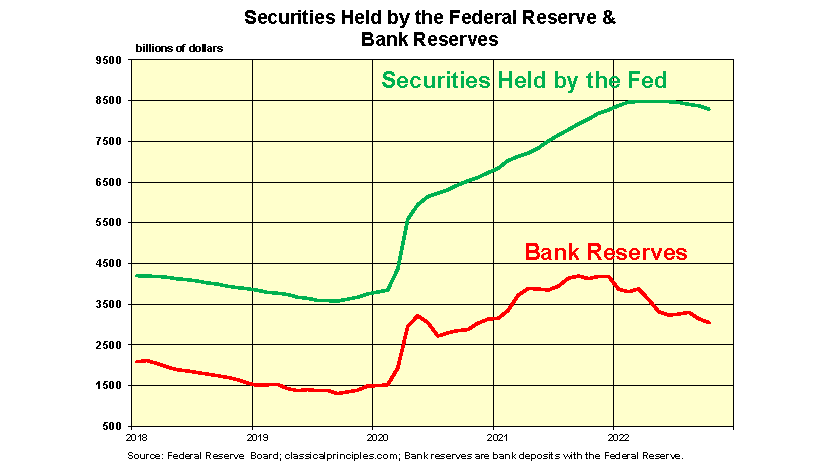
There are various ways to measure a restrictive policy. The most basic is to measure the two components that account for money entering the economy. The first is the Fed’s purchases or sales of securities. The second is the portion of banks’ $3 trillion in Fed deposits those institutions shift or choose not to shift into the economy.
The following chart shows these components through the end of October. The amount of securities held by the Fed has changed little since last December but is down $186 billion since June. Since December, banks have shifted $1.2 trillion of their Fed deposits into loans and investments, completely offsetting the Fed’s restraint. Since June, banks have shifted $178 billion into the economy. Hence, the only restraint on money impacting the economy has been a negligible decrease of $8 billion.
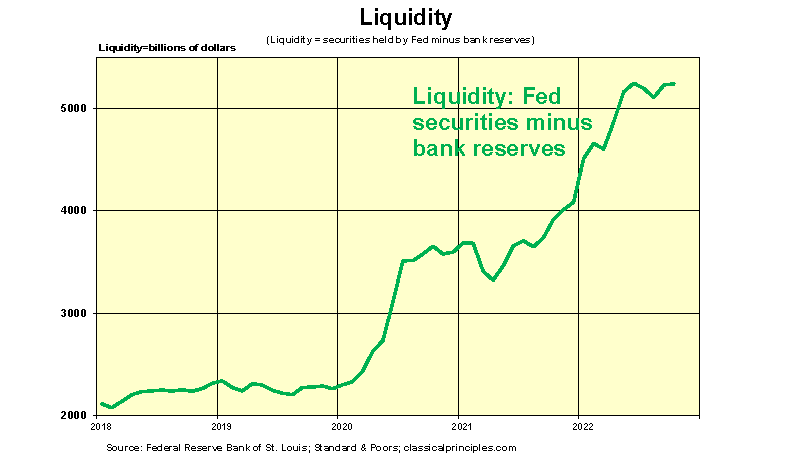
The following chart shows the amount of money entering the economy as a result of actions by both the Fed and the banks. The surge in liquidity that fueled the double-digit increases in spending and inflation is readily apparent. The chart also shows there has been no net increase in the amount of money entering the economy since June.
One conclusion might be that despite noise to the contrary, there has be very little real monetary restraint. However, for the following reasons, monetary policy appears restrictive.
First, money is dynamic. A leveling off after double-digit increases is already a dramatic change. It is also important to note when the Fed has clearly explained its policy objective and how it intends to achieve it.
Second, monetary policy does not occur in a vacuum. Other financial indicators are also behaving as we would expect under a restrictive policy.
Inverted yield curves—where short-term interest rates move above longer-term rates—often precede recessions. The yield curve charts below show actual data through October, which are consistent with an upcoming recession.
Other charts below show more-traditional measures of the money supply are also pointing to restraint.
Hence, despite the liquidity measure showing a substantial amount of bank reserves in the economy, numerous other signs point to monetary restraint. The Fed’s restraint first appeared in July. A normal six-to-nine-month lag suggests a significant weakening in spending and incomes will occur in the first half of 2023.
![]()
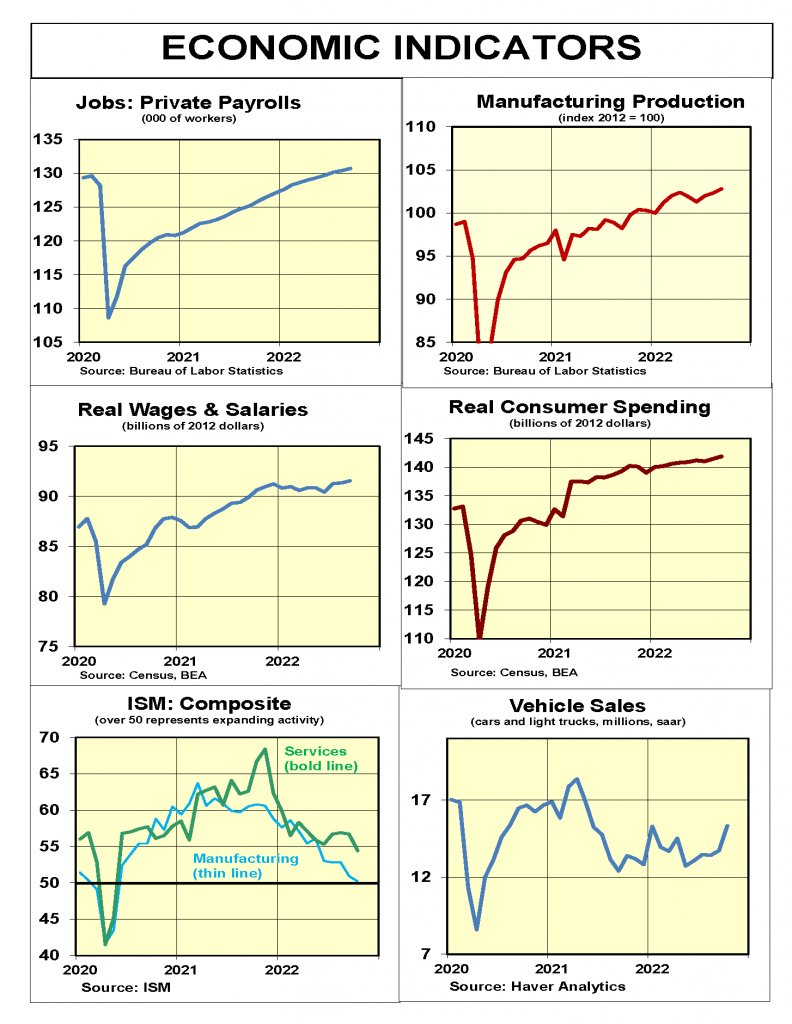
Sensitive Indicators
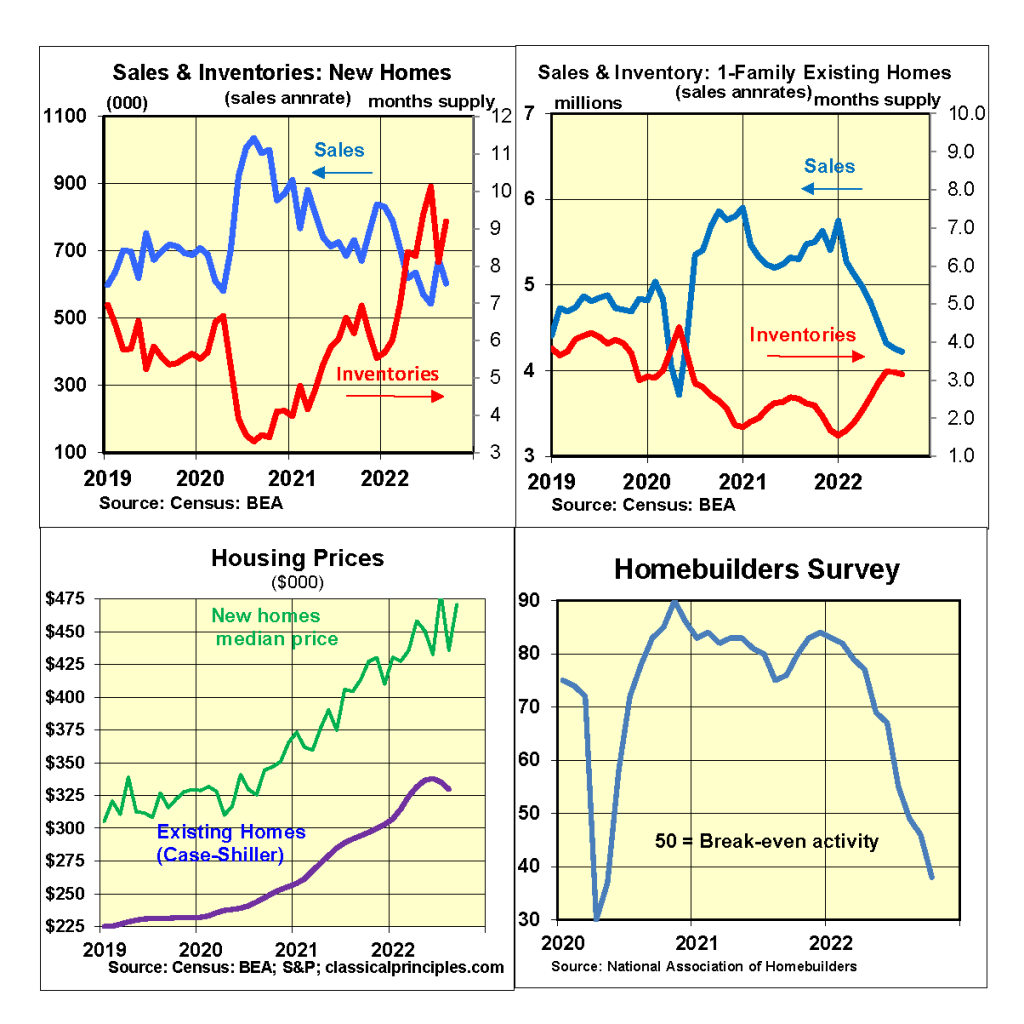
Sensitive short-term indicators remain mostly negative, with some exceptions. The two most reliable early indicators—stocks and housing—continue to point to a sharp downturn.
Most sensitive indicators for September and October also point to an impending downturn. New orders for durable goods are declining even before allowing for higher prices. The October Homebuilders’ survey plummeted to 38, with 50 being normal.
October ISM surveys show manufacturing orders down for the second consecutive month, while new orders for service companies slowed to 56, down from 61.
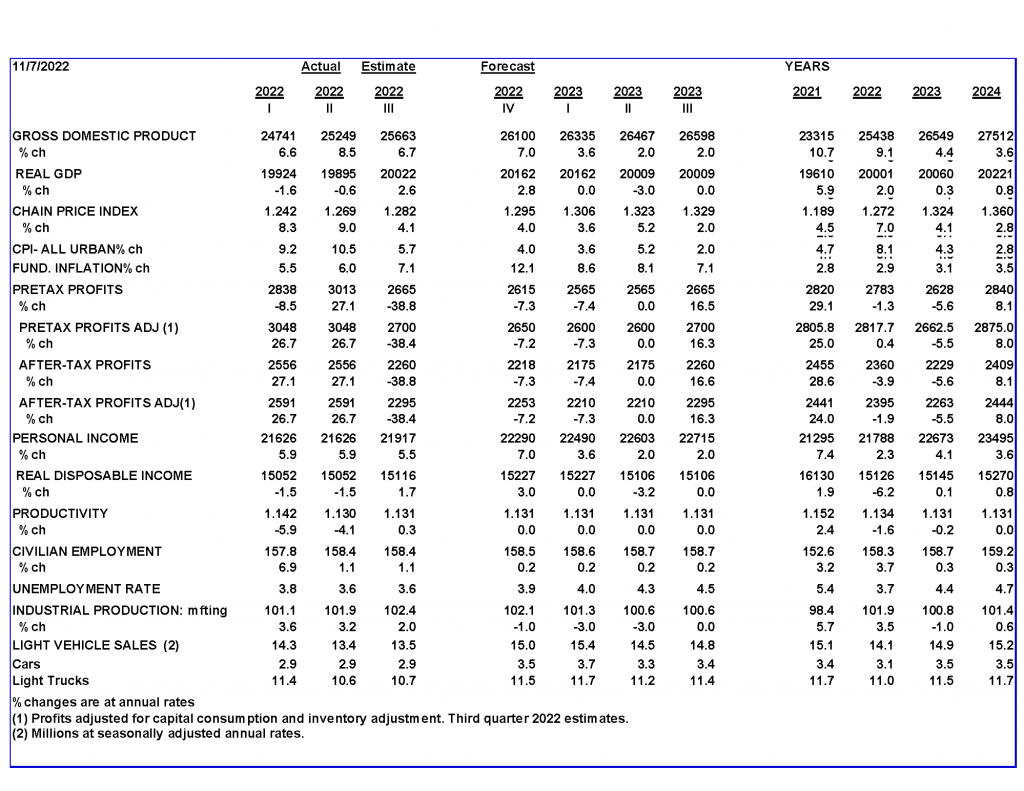
Most coincident indicators continue to show the economy expanding. October employment and wage gains slowed, but auto sales improved. The Atlanta Fed estimates fourth quarter real growth will be 4 percent. This estimate is likely to decline as newer data come in.
![]()
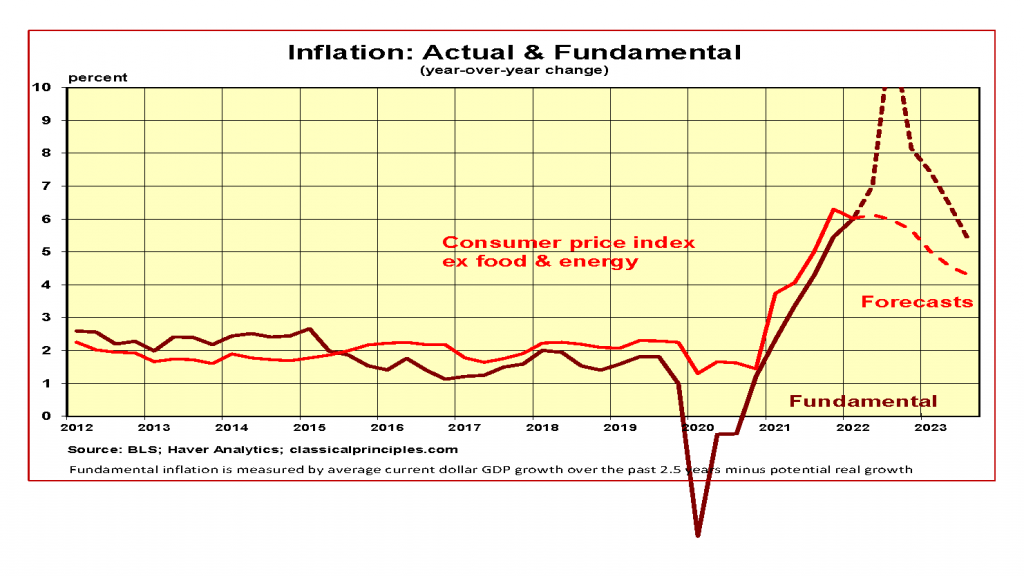
Inflation Indicators
Most commodity prices were down in October, for the third consecutive month. The combination of weaker business activity and an increase in the value of the dollar contributed to the decline.
In contrast to other commodities, oil prices rose in October to $87. If President Biden decides to stop or slow the use of the nation’s oil reserve, oil prices are likely to move even higher.
Inflationary pressures occur whenever the growth in current dollar spending (GDP) exceeds the growth in output. While there is usually a two-year lag before excess spending increases inflation, sharp changes in spending can accelerate the process. This happened when the lockdown collapsed the economy. It also happened when the surge in spending over the past two years led to sharply higher prices.
Over the past year, spending slowed to 9 percent. In the first three quarters of this year, the annualized rate has been 7.3 percent, with the latest quarter at 6.7 percent. These rates are too high to allow a fast decline in inflation
Our forecast anticipates a significant further slowing of spending going into the first and second quarters of next year. While the extent of the slowdown is unclear at this time, we assume spending increases will decline to the vicinity of 2 percent in the first half of 2023.
Without an increase in productivity, inflation will remain around 4 percent early next year. Beyond the first of half of 2023, the spending pace and further progress on inflation depend on how the Fed responds to the likely economic downturn. The longer the Fed decides to maintain its policy of restraint, the more likely the inflation rate will recede back toward the Fed’s target range.
![]()
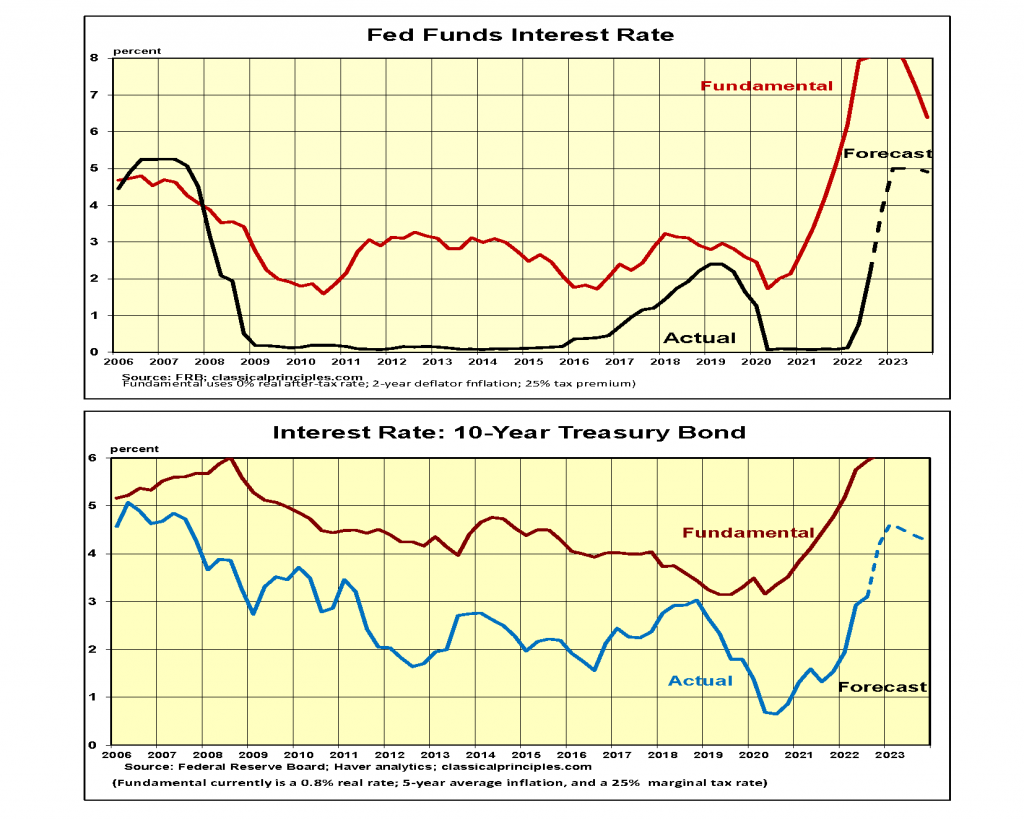
Interest Rates
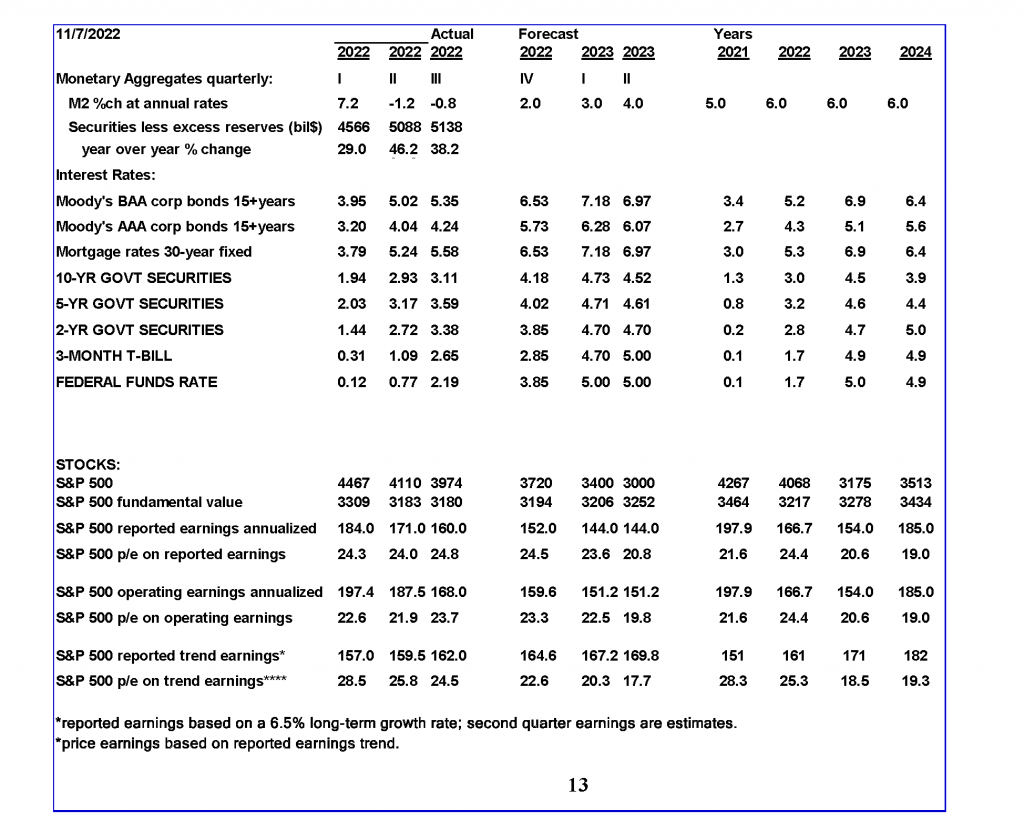
Financial markets currently anticipate the Fed having to move the fed funds rate to the 5 percent vicinity by early next year. Our forecast reflects a similar pattern.
The peak in the fed funds rates will depend on how quickly inflation subsides, the extent of the downturn in the economy, and the Fed’s tolerance for balancing its objectives.
At this point, expectations about the peak in interest rates remain speculative. If the pace of spending comes down as dramatically as we expect, and the Fed follows through as markets anticipate, we expect inflation to fall to the 2 percent vicinity by the third quarter of next year.
We assume the Fed will maintain a restrictive monetary policy through at least the first half of 2023. Consistent with monetary restraint, we expect the fed funds rate to move above the 10-year rate and remain above it throughout the 2023 recession.
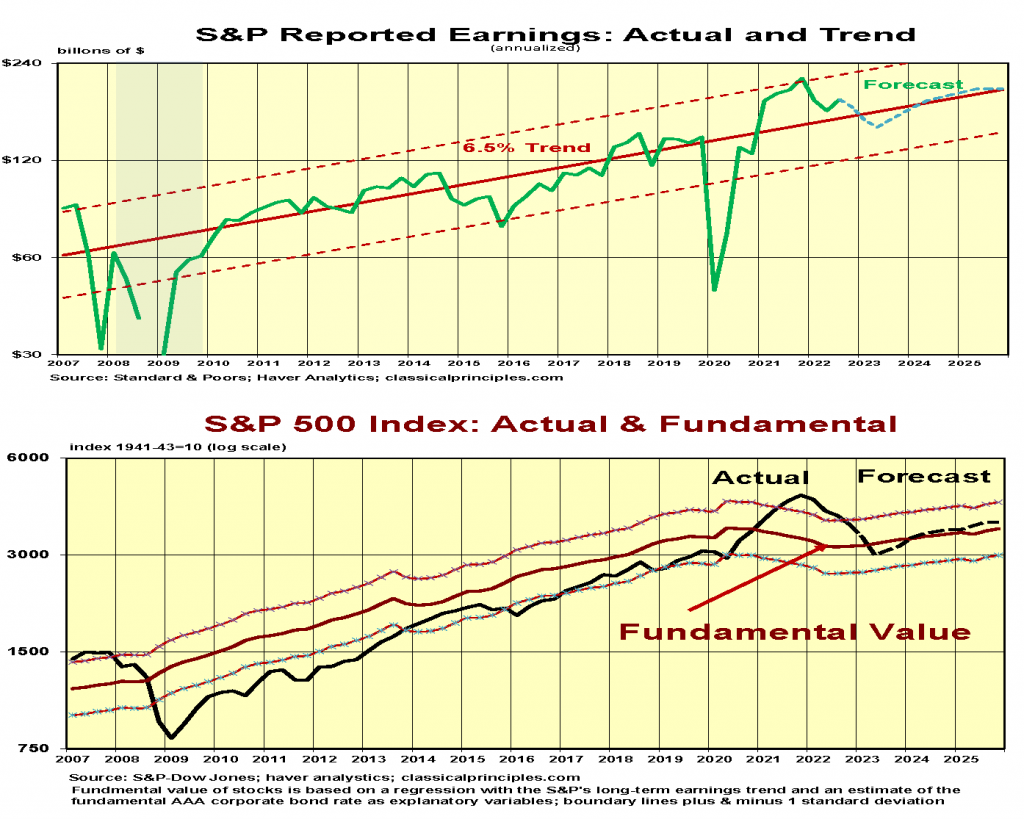
Stock Prices
The S&P500 reports earnings in the third quarter were down 7 percent from a year ago. However, they are above those of the second quarter and 14 percent above their longer-term trend.
Zach’s says earnings estimates for upcoming quarters are being cut significantly. With third quarter earnings above trend and with a recession ahead, lower earnings are expected.
Our stock market model, which uses trend earnings and our estimate for fundamental longer-term interest rates, continues to estimate the underlying value of the S&P500 in the vicinity of 3,200 this year and 3,300 next year.
An alternative stock market model using current long-term interest rates places the value of the S&P500 close to 3,600. Hence, if longer-term interest rates stay at current levels, the S&P500 is close to being appropriately valued.
There is a light at the end of the tunnel if longer-term interest rates remain close to current levels. However, if our forecast for additional increases in interest rates prevails, stocks will remain vulnerable to continued downward pressure.
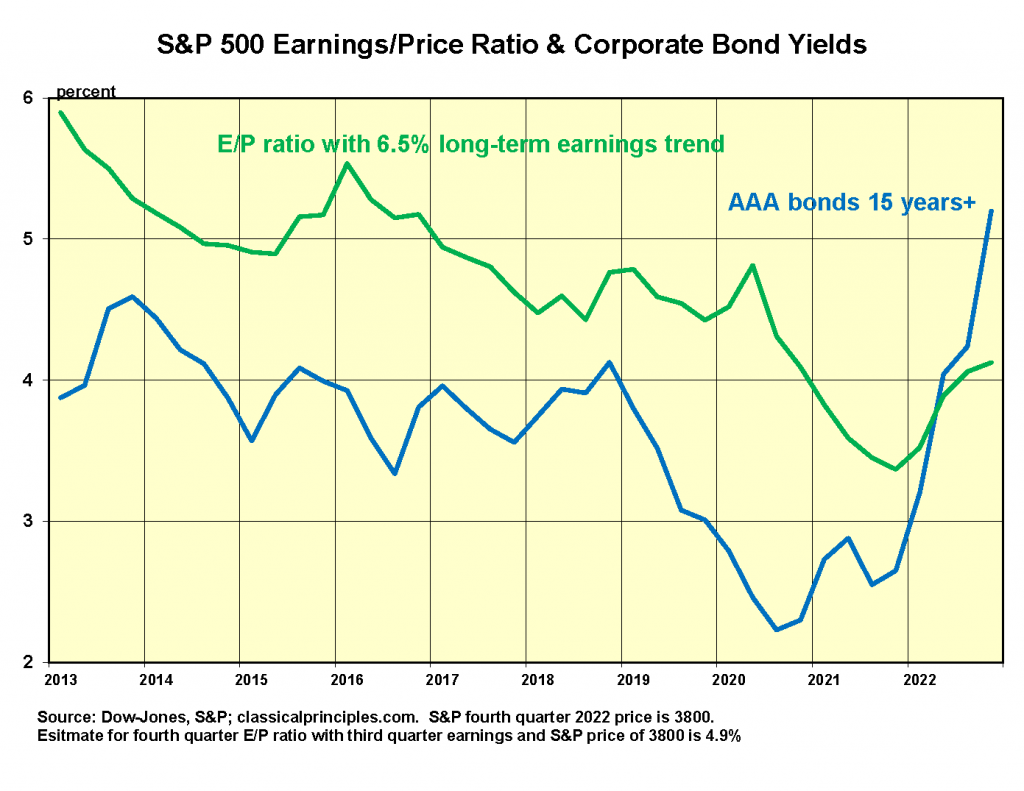
The following chart illustrates an alternative way to ascertain whether stocks are over- or under-valued. It compares the earnings/price (E/P) ratio on the S&P500 index to the yield on AAA corporate bonds.
Instead of using actual S&P earnings (which won’t be available until February), the chart uses the longer-term earnings trend. Historically, the E/P ratio on stocks has typically been below the yield on bonds because stocks have a growth premium not available to bonds.
The past decade has been unusual with E/P ratios often above the bond yield. This is another sign of how attractive stocks were.
The E/P ratio for the fourth quarter of this year uses the underlying earnings trend and a price of 3,800 for the Index. It is well-below the bond yield and suggests the relative attractiveness of bonds to stocks has increased substantially.
For those interested in looking at actual earnings, we calculate a fourth quartter E/P ratio assuming earnings are equal to the third quarter earnings and the S&P price is 3,800. With these assumptions, the fourth quarter 2022 ratio is 4.9 percent.
Conclusion: The yield on bonds has recently moved above the yield on stocks. After several years of avoiding bonds like the plague, investors can begin to add a small amounts to their portfolios.
More economic reports by Robert Genetski for Heartland Daily News.
For more great content from Budget & Tax News.
For more from The Heartland Institute.


")

