

Fed interest rate hikes further invert yield curve (when long-term bond yields fall), “running on the same Fed path that has repeatedly ended with recession.”
[Ed. note: Published before the Fed announced another 0.5 percent interest rate hike on December 14.]
The yield on 10‐year Treasury bonds fell below 3.5% recently—down from 4.25% on October 24 before the Federal Open Market Committee (FOMC) last raised the top fed funds rate to 4%. The 10‐year bond yield has been lower than the interest rate on 3‑month Treasury bills for well over a month, leaving the spread between short and long rates the widest in decades.
If the FOMC paused raising rates at the December 12–13 meeting, the yield curve is already inverted enough to virtually guarantee recession next year, according to Arturo Estrella, a renowned veteran researcher from the New York Fed. Yet the FOMC seems determined to invert the curve even more by pushing short‐term rates a half‐point higher—even though, ironically, the Fed always cuts rates deeply in the wake of Fed‐orchestrated recessions.
“In a typical recession,” Ben Bernanke’s recent book explains, “the Fed stimulated the economy by cutting the funds rate between 5 and 6 percentage points.” The Bernanke Fed was no exception, cutting the fed funds rate from 5.25% in September 2007 to 0.25% in December 2008.
Why risk such predictable and avoidable instability?
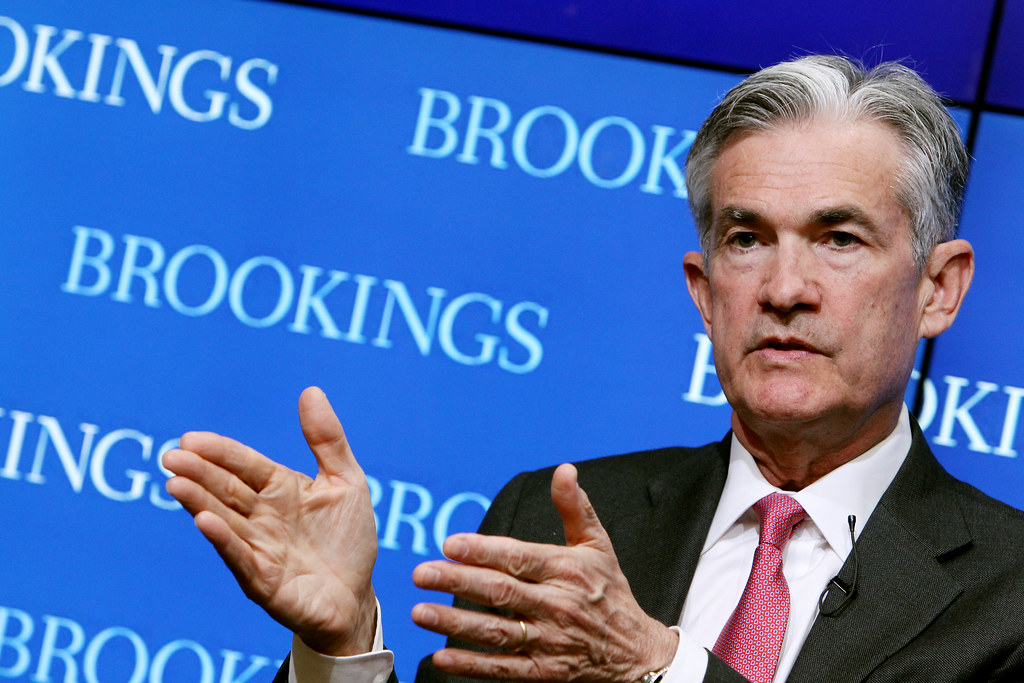
Fed Chairman Jerome Powell offered an apparent preview of an explanation in his November 30 presentation at the Brookings Institution, “Inflation and Labor Markets.”
He provided charts depicting year‐to‐year changes about a variety of concerns, such as earnings and core services inflation, but took little notice of overall [Personal Consumption Expenditures] PCE inflation in recent months. “One problem I had with Powell’s speech,” tweeted Paul Krugman, “was that all the charts were YoY, [12‐month averages] which probably miss much of the disinflationary news of recent months.”
Asked about recent inflation, Chair Powell’s only comment was “while the October inflation data received so far showed a welcome surprise to the downside. These are a single month’s data, which followed upside surprises over the previous two months.”
A single month is certainly too short a period to detect changes in trend, but 12 months are too long. The past four months of lower inflation, on the other hand, cannot be casually dismissed just because some months were lower than others.
PCE inflation averaged 4.3% in the third quarter, and the Cleveland Fed nowcasts it to remain about the same in the fourth (rising 0.035% a month). If so, inflation in the last two quarters would then be three percentage points lower than in the first two, and just two percentage points higher than the last FOMC projected goals for late 2024. The nowcast estimate for December may prove too high, however, if falling home prices and rents begin showing up in PCE housing inflation sooner than some anticipate.
For the past four months, July through October, PCE inflation rose at an annual rate of 2.6%. If we arbitrarily exclude falling prices in July, PCE inflation still averaged 3.8% for the past three months. Those numbers would have been substantially lower were it not for the infamously slow and misleading ways the Bureau of Labor Statistics belatedly reports “housing inflation” in the PCE index and “shelter inflation” in the CPI. For the consumer price index less shelter, for example, the annual rate of inflation was 0.2% from July through October—two-tenths of one percent.
At the November 1–2 meeting of the FOMC, “several participants remarked that rent increases on new leases had been slowing in recent months, but participants also noted that it would take some time for this development to show up in PCE inflation.” The FOMC knows that the documented decline in rents and home prices for the past four months will show up as lower PCE and CPI inflation in the not‐too‐distant future. That means they must also know recent inflation numbers (although sharply reduced from the first half of the year) exaggerate the underlying trend in core and total inflation.
The S&P Case‐Shiller index of home prices fell at an annual rate of 5.4% in July, 13% in August and 11.5% in September, and doubtless kept falling since then. More over‐tightening ahead would surely worsen an intensely swift housing contraction.
Over time, such large drops in house prices do predict changes in rents to some extent, but quite imperfectly and with a long lag. If Zillow estimates that your house is worth 15% less than it was a few months ago, their estimate of what you could rent it for will also drop. So too will the Bureau of Labor Statistics (BLS) estimate of owner‐equivalent rent (OER) used in PCE and CPI inflation. But that takes a long time.
Owner‐equivalent rent is even more problematic for inflation measurement than rent. Jeffrey Kleintop, chief market strategist at Charles Schwab, finds “Core CPI would be 2.5% if the housing component was based solely on rental rate data (excluding Owners’ Equivalent Rent).”
Using the PCE price index for rents (which uses the same BLS sources as the CPI), Xiaoqing Zhou and Jim Dolmas of the Dallas Fed find “current house price growth is most strongly correlated with rent inflation 18 months later, with the correlation coefficient reaching 0.74 at its peak.”
While waiting patiently for the PCE and CPI housing inflation estimates to catch up with the reality of falling house prices and rents, it would be safer for Fed policymakers to completely exclude PCE housing inflation from their near‐term objectives rather than amplify this statistical fiction by focusing on “core services” (nearly synonymous with rent and OER).
At the end of his November 3 press conference, however, Chair Powell concluded by saying “now you see services inflation—core services moving up… That means we have to have policy being more restrictive.”
The grave danger of basing Federal Reserve interest rate changes on “core services” is that rent and OER account for about 24% of core services in the PCE inflation and 34% of core services in the CPI. If we graph changes in the CPI for core services and changes in the CPI for shelter over recent decades the two series look as if they are identical.
In his November 30 talk, Chairman Powell partly corrected his December 3 mistake by switching to “core services less housing” thus showing a separate blue line for the illusory uptrend in housing inflation. But his persistence in using year‐to‐year changes in core inflation remains disingenuous. “As core [CPI] inflation rose from 4.6% in October 2021 to 6.3% in October 2022,” notes the skilled Wall Street Journal reporter Gwynn Guilford, “shelter inflation contributed around 1.4 points of the acceleration.”
The “stubbornly sideways” pattern Chair Powell describes in Core inflation is actually a blend of overweighted pseudo‐inflation in housing rents and rising airline fares (when oil was rising) falling prices for many items with much smaller index weights such as apparel, appliances, fruits and vegetables, or tickets to sporting events.
Rent and OER, Guilford remarks, is an overwhelming 41.7% of core CPI, and a domineering share (roughly 20%) of core PCE.
Figure 3 in Powell’s latest speech candidly compared “Market rents and PCE housing services inflation”—all measured questionably, as Paul Krugman noted, as monthly percentage changes from a year earlier. Even on that overly smoothed basis, all private surveys of new rents peaked in late 2021 or early 2022 and have since slowed dramatically since. Yet the PCE housing services inflation (rent and OER) nonetheless kept marching higher and higher as shown in the red line.
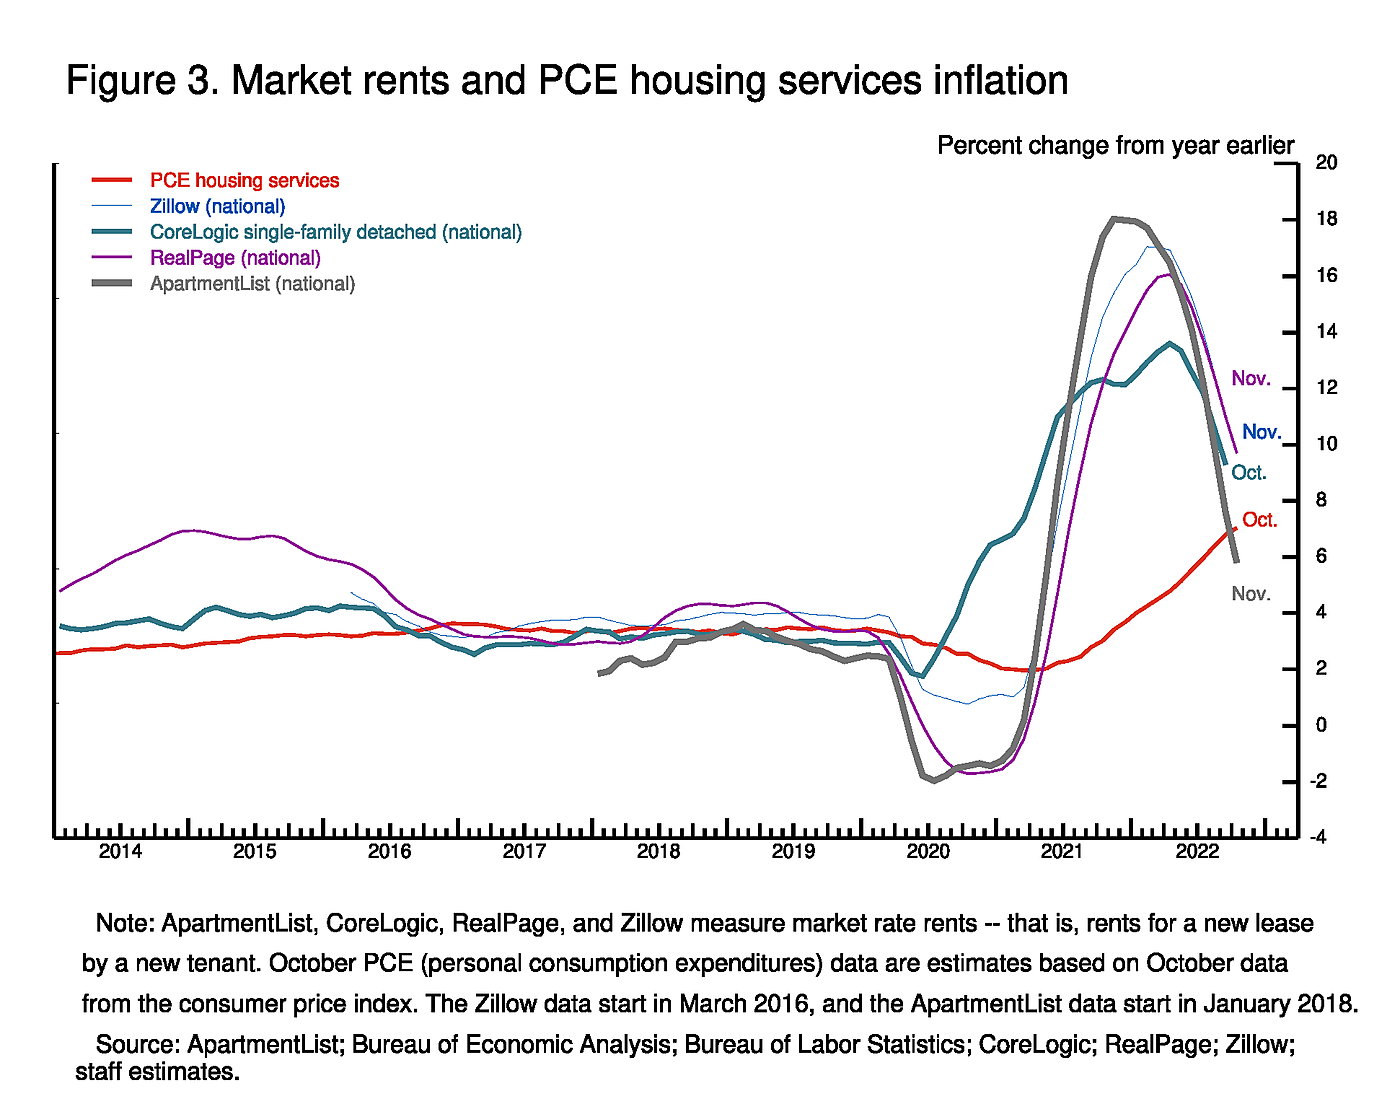
Rent on new leases were rising most rapidly in the summer of 2021 on a monthly basis, but the Chairman’s graph depicts the year‐to‐year peak as later that year and early this year. The trouble with comparing recent monthly rents with what they were a year ago is that each recent average is elevated by including the previous 11 months. This makes it look as though market rents this November were rising at rates of 6% or more, although rents on new leases have been falling since September. To say rent or any other price is too high is not the same as saying it is rising.
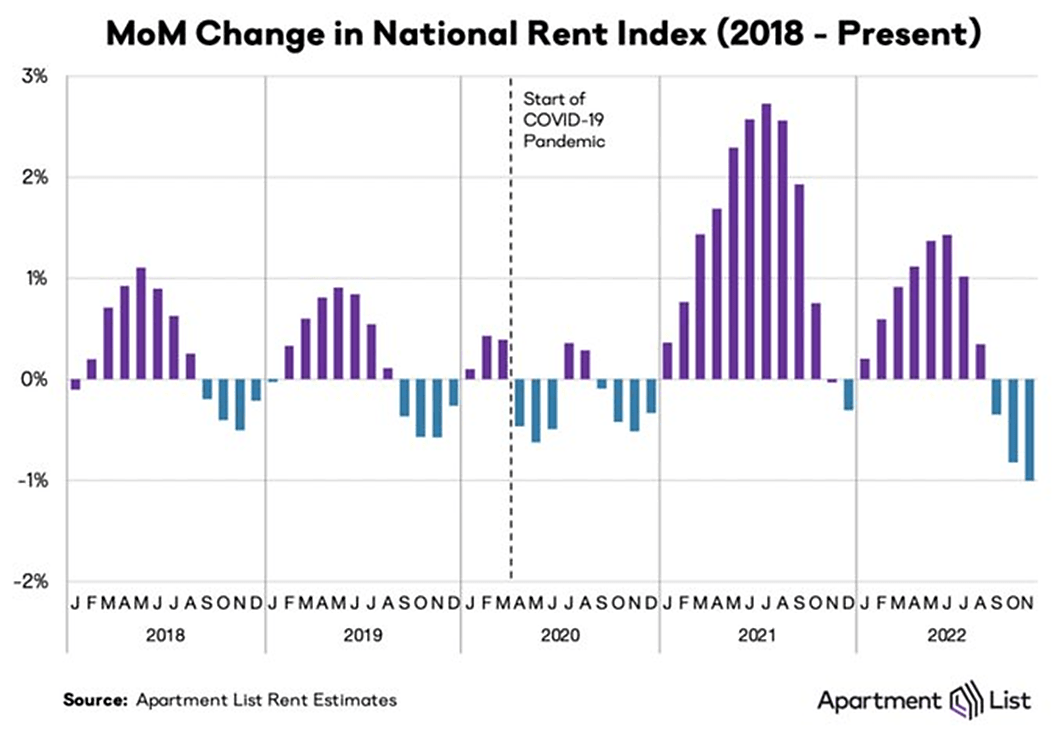
Apartment List’s MoM (month‐on‐month) changes, notes Krugman, are “confirming that new‐tenant rents are really rolling over—much more than you can explain with seasonal factors.”
Like the long lag between falling housing prices and rising OER estimates in official inflation reports, recent BLS rent estimates reported in PCE and CPI inflation data are likewise held far above market rent by surveys and contracts leftover from much earlier. Researchers from the Cleveland Fed and BLS found, “New‐tenant rent indexes more quickly reflect inflationary pressures,” and “Rent inflation for new tenants leads the official BLS rent inflation by 4 quarters.” That suggests we may have to wait until mid‐2023 before falling rents on new leases finally start showing up as lower rent inflation in PCE and CPI inflation reports.
In a later blog, I will argue that Chairman Powell’s latest speech was statistically mistaken to exclude good news about food and energy inflation by redefining the FOMC target in terms of core inflation, including “core services” (excluding home electricity and gas services).
“We do not want to over tighten because cutting rates is not something we want to do soon,” says Chairman Powell; “So that’s why we’re slowing down and going to find our way to what the right level is.” Yet cutting rates is exactly what the Fed was forced to do every other time they tried to keep short‐term rates above the long‐term bond yield and did not undo that mistake soon enough to prevent global recessions.
The FOMC is nearing the end of a rapid daredevil sprint toward a steep cliff, running on the same Fed path that has repeatedly ended with recession and sharply cutting rates. To avoid cutting rates, they would need to avoid another unnecessary recession.
Alan Reynolds is a senior fellow at the Cato Institute and former vice president of the First National Bank of Chicago. He served as research director with Jack Kemp’s 1995–96 Tax Reform Commission and with Larry Kudlow and Alan Greenspan as a member of President Reagan’s 1981 transition team.
This work is licensed under a Creative Commons Attribution-NonCommercial-ShareAlike 4.0 International License.
For more great content from Budget & Tax News.


")

