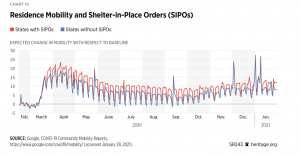
Americans altered their behavior to protect themselves before government policies were put in place, concludes a just-released statistical analysis of the public response to the COVID-19 pandemic.
Using Google mobility data through May 31, the authors were able to get a sense of how people responded to the pandemic during its early months. Three graphs show that behavior was nearly identical in states with shelter-in-place orders compared to those without.
“[P]eople began changing their behavior before shelter-in-place orders were issued, suggesting that they were seriously concerned about the disease before the implementation of government shutdown policies,” the Heritage Foundation report says. “Altogether, these behavioral changes quelled case growth more than government policy did.”

The report pointedly adds that “more specific policies geared toward protecting the elderly, especially those in nursing homes, could have been much more effective at saving lives.”
Data Breakdown
The report, “A Statistical Analysis of COVID-19 and Government Protection Measures in the U.S.,” was authored by Kevin Dayaratna and Andy Vanderplas, both Heritage scholars. Using data from the Centers for Disease Control and Prevention (CDC), the study charts the number of COVID cases, hospitalizations, and deaths from January 2020 to February 2021.
Data show that the case-fatality ratio (ratio of fatalities to confirmed cases) exhibited markedly different behavior over time. “[T]he case-fatality rate (new fatalities divided by new cases) around the apex of the first wave in mid-April was almost 9 percent,” the researchers found. “The case-fatality rate at the height of the second wave (in late July) was approximately 2 percent.” If recent data hold true, due to more numerous reported infections and fewer fatalities, the height of the third wave (mid-December) “will not likely rise above 2 percent.”
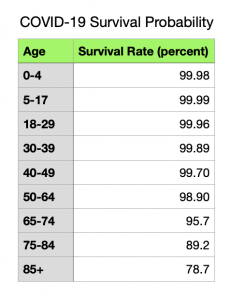
An examination of hospitalization and mortality data for various age groups, however, reveals significant disparities amongst cohorts. “The COVID-19 virus proliferated at different levels in changing hot spots throughout the country, with mortality heavily weighted toward older age groups,” the authors found. Data presented in the study confirm the susceptibility of older people to the pandemic (see table).

The share of COVID-19 deaths among babies and toddlers, school-age children, and young adults (under 30) never exceeded 0.6 percent. But for those 65 and older, the comparable figure on average was 18.8 percent.
Data gathered by the Heritage analysts show that the percentage of COVID-19 deaths in nursing homes was significantly higher – “over 50 times higher on average” (emphasis in the original) – than the general population’s mortality rate. “This discrepancy illustrates that residents in nursing homes are particularly vulnerable and thus would have benefitted significantly from better protection during the course of the year,” Dayaratna and Vanderplas conclude.
Most people, including the elderly, recover from COVID-19, and advances in medical treatment have significantly improved their chances to do so the study notes. “These estimates, however, are also based on confirmed cases and exclude unconfirmed cases,” the authors add. “Infectious fatality ratios, which include these unconfirmed cases (and thus incorporate more recoveries in the calculation), suggest even higher survival rates.”
Hospitals Withstood the Surge
The rapid spread of the disease in the spring of 2020 led to fears that hospitals would be unable to cope with the patient load. During the virus’s three waves, hospitals in some states did report difficulties in allocating resources to deal with the pandemic, with some struggling well into late November. However, as of January 30, 2021, the national intensive care unit (ICU) occupancy rate was about 76 percent with only six states having more than 85 percent of their beds occupied.
Contributing to hospitals’ capacity to withstand the periodic surge in patients was the movement of hot spots around the country. The Northeast had the greatest number of infections in the pandemic’s early phase but by summer had been overtaken by California, Arizona, and Florida. From June through October, some localities in Michigan, Wisconsin, and Texas saw a spike in new cases. By November, the Northeast, southern California, and Florida experienced a rise in infections.
Even though the number of new cases became more geographically dispersed as the pandemic wore on, California, despite maintaining strict lockdown rules throughout the pandemic, continued to experience relatively high growth in new cases from the end of summer through the winter.
Shelter-in-place orders (lockdowns) were issued in 43 states and the District of Columbia, with some states loosening restrictions as new cases began to wane. This easing of restrictions prompted people to shelter-in-place less frequently beginning in the summer and revert to “baseline” (pre-COVID) behavior. This may have contributed to spikes in cases in the ensuing months. “For the most part, however, people both in states that have issued shelter-in-place orders, as well in those that have not, have still stayed at home at levels higher than baseline levels in January 2020 before COVID-19 was declared a pandemic on March 16 [2020],” the authors point out.
Co-author Kevin Dayaratna, Ph. D., principal statistician, data scientist, and research fellow at Heritage’s Institute for Economic Freedom told Health Care News the driving force behind the paper.
“In this paper, we sought to analyze the plethora of data that is out there to understand what we could have done differently in case something like this ever happens again,” says co-author Kevin Dayaratna, Ph. D., principal statistician, data scientist, and research fellow at Heritage’s Institute for Economic Freedom. “We hope the worst of the pandemic, at least in this country, is in the rear-view mirror, and we’ll be out of this mess as soon as more people get vaccinated.”
Bonner R. Cohen, Ph.D., (bcohen@nationalcenter.org) is a senior fellow at the National Center for Public Policy Research.
Internet info:
Kevin Dayaratna, Andrew Vanderplas, “A Statistical Analysis of COVID-19 and Government Protection measures in the U.S.,” The Heritage Foundation, March 18, 2021: https://www.heritage.org/public-health/report/statistical-analysis-covid-19-and-government-protection-measures-the-us


