


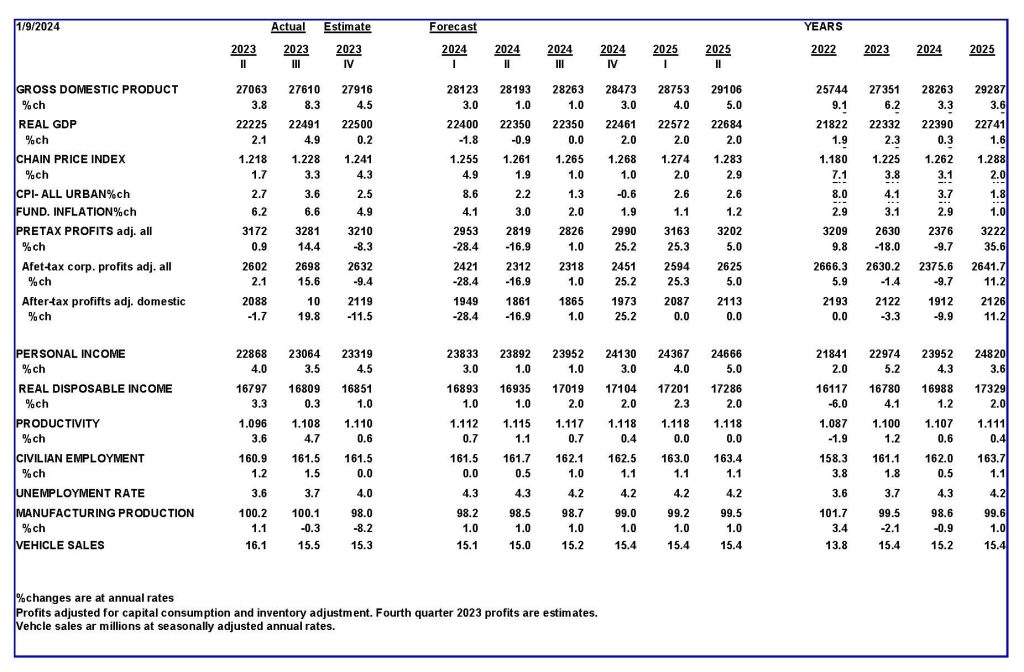
The critical economic question behind the economic outlook for 2024 is this: Do measures of money still define the outlook for the U.S. economy as they have in the past? Despite having a restrictive monetary policy for more than a year, spending and real growth accelerated in the third quarter of 2023 and appear to have ended the year in decent shape.
This divergence between money growth and economic growth raises a key question—does money supply still matter? Is it the prime factor controlling changes in spending? Or, has there been a fundamental change between money and its relation to the economy?
The following charts show the history of two-year annualized changes in total spending (GDP) and like changes in two measures of money. The first money measure we’ll call raw money, which consists of currency plus Fed securities holdings minus bank reserves. Changes in raw money capture the increases or decreases in the money supply attributed to the government. The second is the Fed’s conventional M2 measure consisting of currency and bank deposits.
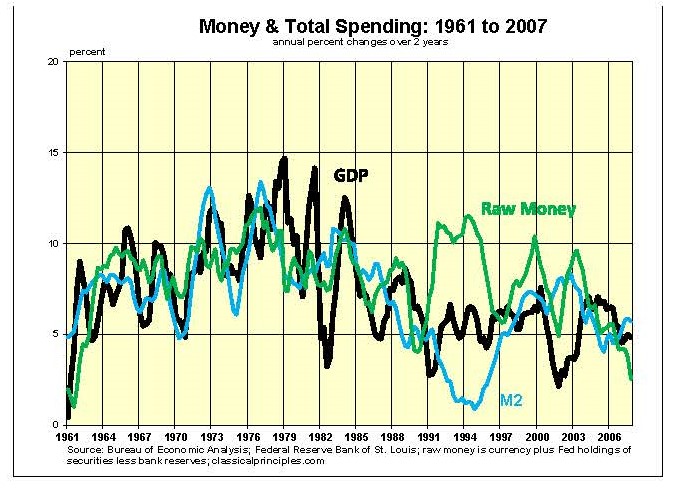
The chart shows both money measures closely tracked the economy from 1961 to 1990. However, in the early 1990s the measures moved in opposite directions from the economy. Then, from 1997 to 2007 the relationship was again stable.
As the next chart shows, prior to and into the financial crisis in 2008, M2 increased significantly. However, raw money plummeted as the Fed sold massive amounts of securities, pulling money out of the economy.
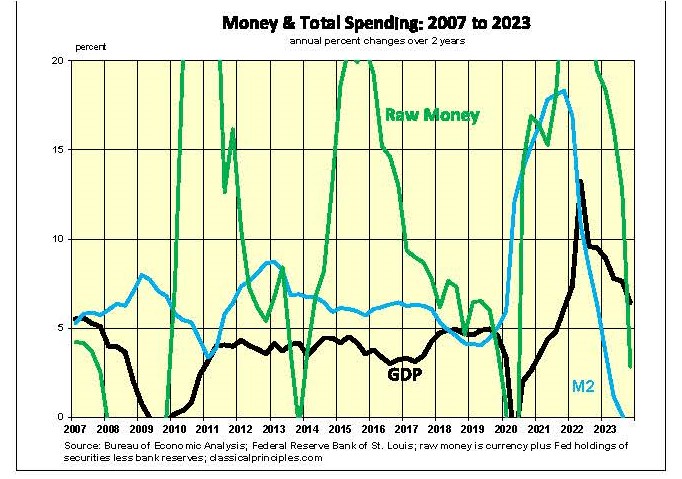
Since 2020, both money measures have been highly erratic, as explosive increases were followed by an equally crushing move toward restraint.
What does it all mean?
Over time, the management of monetary policy has gone through significant changes. Prior to 1990, the relationship between these measures of money and the economy was very stable. For raw money the average deviation from GDP was 2.4 percentage points. It was less than one percentage point for M2.
From 1990 to 2007, these measures were more erratic than in the earlier years. With this erratic behavior, the relationship between money and the economy became less obvious. Raw money again increased on average about 2 percentage points faster than the change in GDP, while the spread for M2 was again less than a percentage point. Despite these close average relationships, M2 gave false signals at both the beginning and end of this period.
Although not apparent from looking at two-year averages, raw money gave a correct signal in anticipation of the 1990 downturn and accurately predicted the major financial crisis in 2008.
From 2008 to 2023, as the Fed’s money management became progressively more erratic, the relationship of money to the economy changed.
The growth in raw money has continued to increase faster than the growth of GDP. For the period as a whole, raw money rose on average 7 percentage points faster than the economy. M2 rose 3 percentage points faster. As a result, it has taken considerably more raw money to generate a change in M2 as well as more M2 to generate changes in GDP.
The Fed’s efforts to guide the economy became more like driving a car with great play in the steering wheel: less control and progressively more risk.
The relative stability in GDP growth from 2011 to 2019 was due to the Fed keeping the growth in raw money at its new norm of 5 percentage points faster than the growth in GDP.
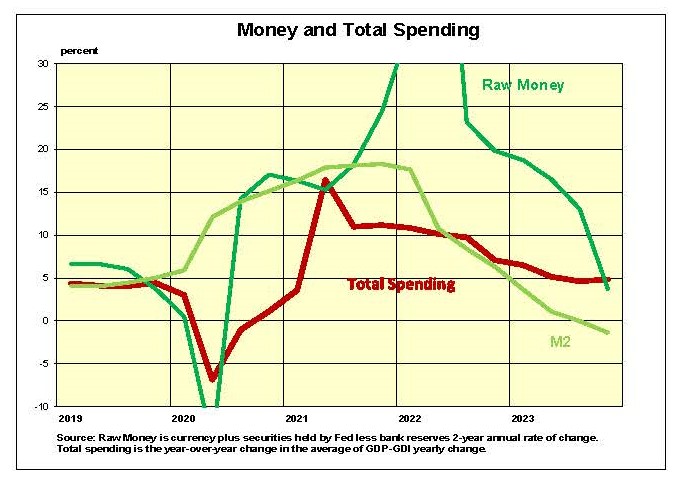
The next chart shows these relationships from 2019 to 2023. The economy in the second half of 2020 was helped by the now-famous money surge that help send current spending up 15 percent in 2021 and led to the 40-year high in inflation. Over the past four years, raw money and M2 moved in a similar pattern.
To summarize, monetary events since 2007 show a hyperactive Federal Reserve making major shifts in monetary policy that often created serious problems for the economy.
The abrupt shift in mid-2022 to reducing the supply of both raw money and M2 has had the expected impact. Yearly spending slowed from 9.7 percent in the third quarter of 2022 to 4.6 percent in the year ending in the third quarter of 2023.
Conclusion: Money Matters
The $27 trillion U.S. economy tends to be remarkably stable. It can take an extended period of two years of significant movements in raw money to have a significant impact on spending.
It is notable that since 2008, it has taken a significantly greater change in raw money or M2 to support changes in total spending. Stated differently, the economy has become less sensitive to changes in Fed policy.
The implications of this analysis for the coming year are significant. Two-year annualized growth in raw money has gone from a peak of 63 percent in the second quarter of 2022 to less than 4 percent in the fourth quarter of 2023. M2 has gone from 18 percent to -1 percent.
If the economy has adjusted to needing a greater growth in money before, the current lack of monetary growth would represent extreme monetary restraint. As such, it raises the risk of a serious downturn in the economy in the year ahead.
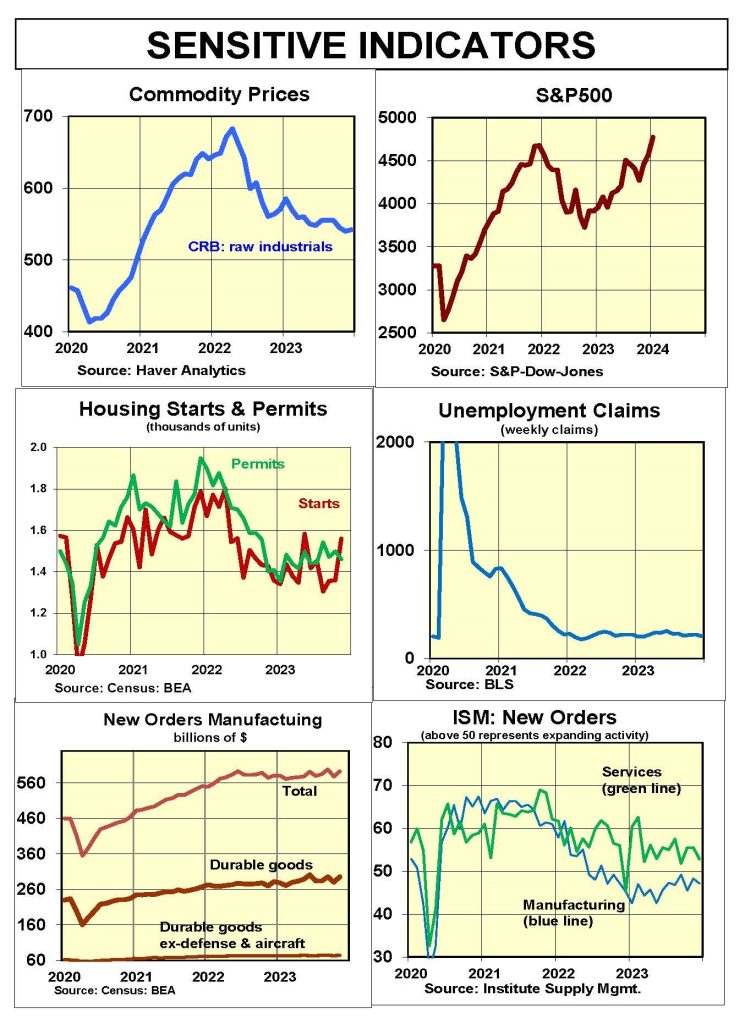
Sensitive Indicators
One way to predict the extent of a potential economic downturn is to track sensitive economic indicators. Unfortunately, two of the most reliable sensitive indicators are pointing in different directions.
Housing activity has historically been one of the most reliable early indicators of a downturn in the economy. With the exception of prices, most housing indicators are pointing toward a serious downturn. Despite a drop in mortgage rates, the December Homebuilders’ index remained in negative territory. Sales of both new and existing homes are down sharply.
Meanwhile, raw industrial commodity prices are down 35 percent from their peak in March of 2022. December ISM business surveys for new orders were mixed, with declines for manufacturers but increases for services.
In addition, the S&P500 and other stock market indexes have hit all-time highs and show no signs of any weakness in the economy.
![]()
Inflation Indicators
Inflation continues to decline. Our estimate of the underlying or fundamental inflation rate shows inflation in the 2 percent vicinity by the middle of this year. The main force driving inflation lower is our projected slowdown in current dollar spending and income.
The second chart shows actual inflation through November. The six-month annualized core inflation rate remains at 3 percent. If current dollar spending (GDP) continues to increase at a 5 percent annual rate in 2024, inflation will remain uncomfortably high.
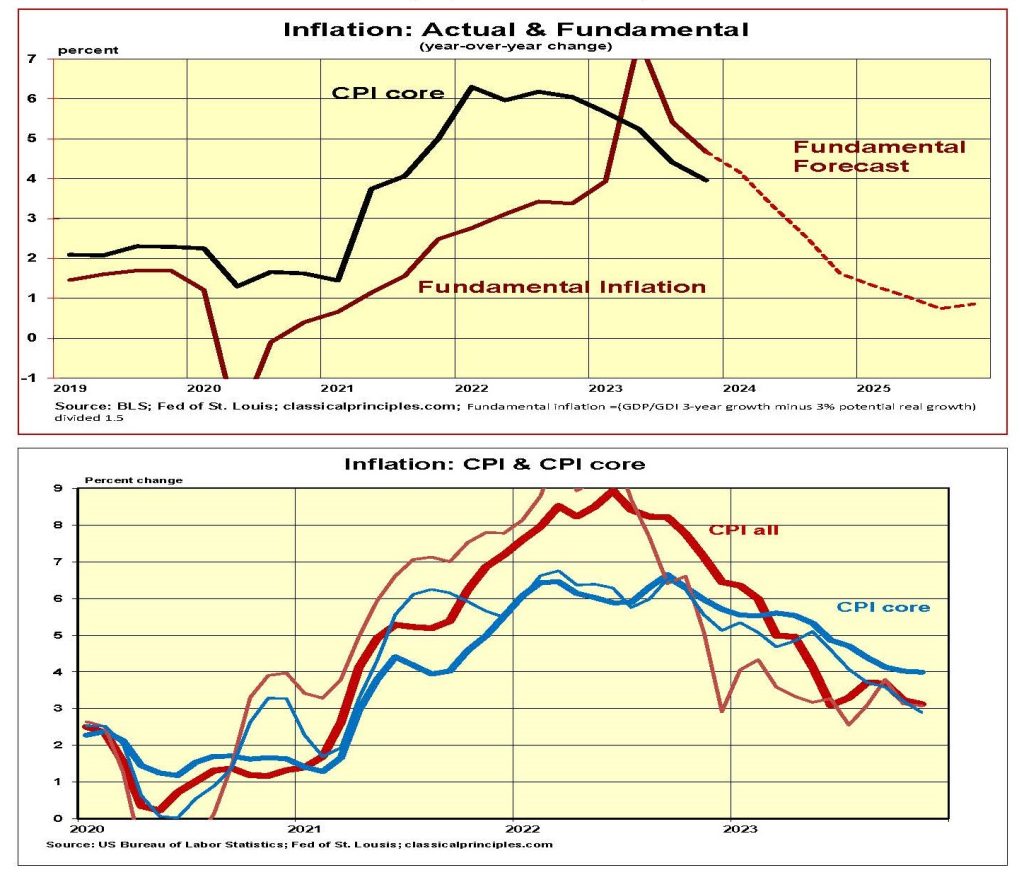
This is why Federal Reserve Chairman Jerome Powell continues to claim interest rate cuts are off the table. Even so, financial markets expect a rate cut in March. It will probably take more signs of a decline in the economy, however, to get the Fed to cut rates as soon as that.
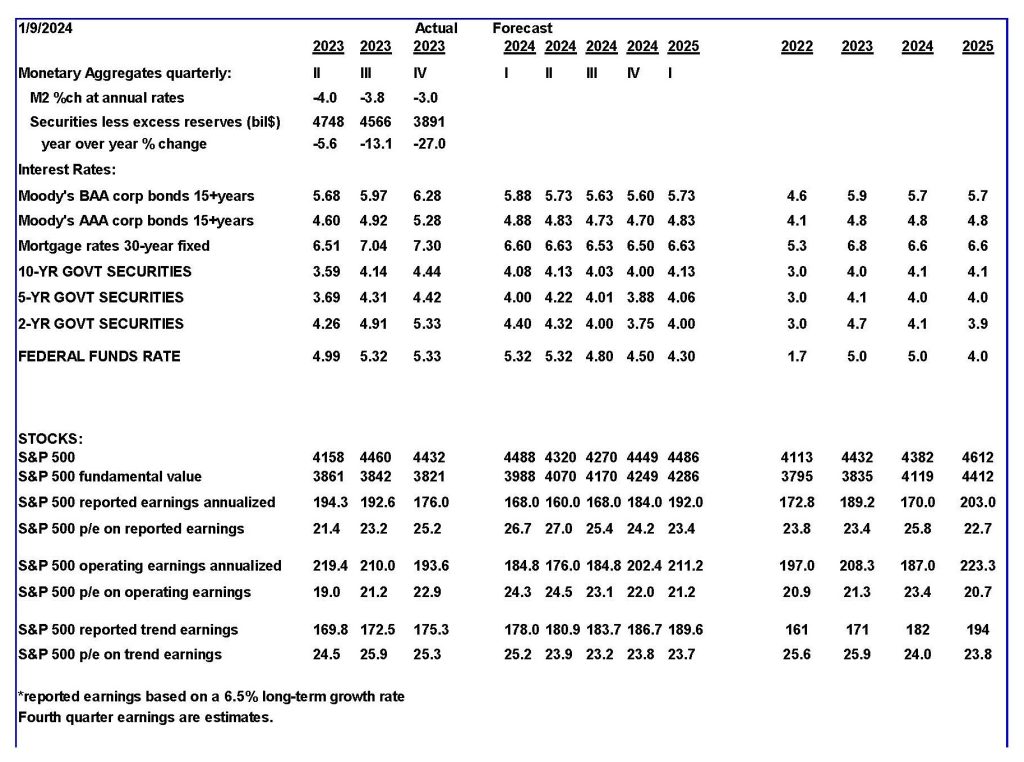
Financial markets’ expectations of a cut in interest rates will eventually be realized if the economy continues to weaken. Our forecast is that short-term interest rates will be heading down by the third quarter of 2024.
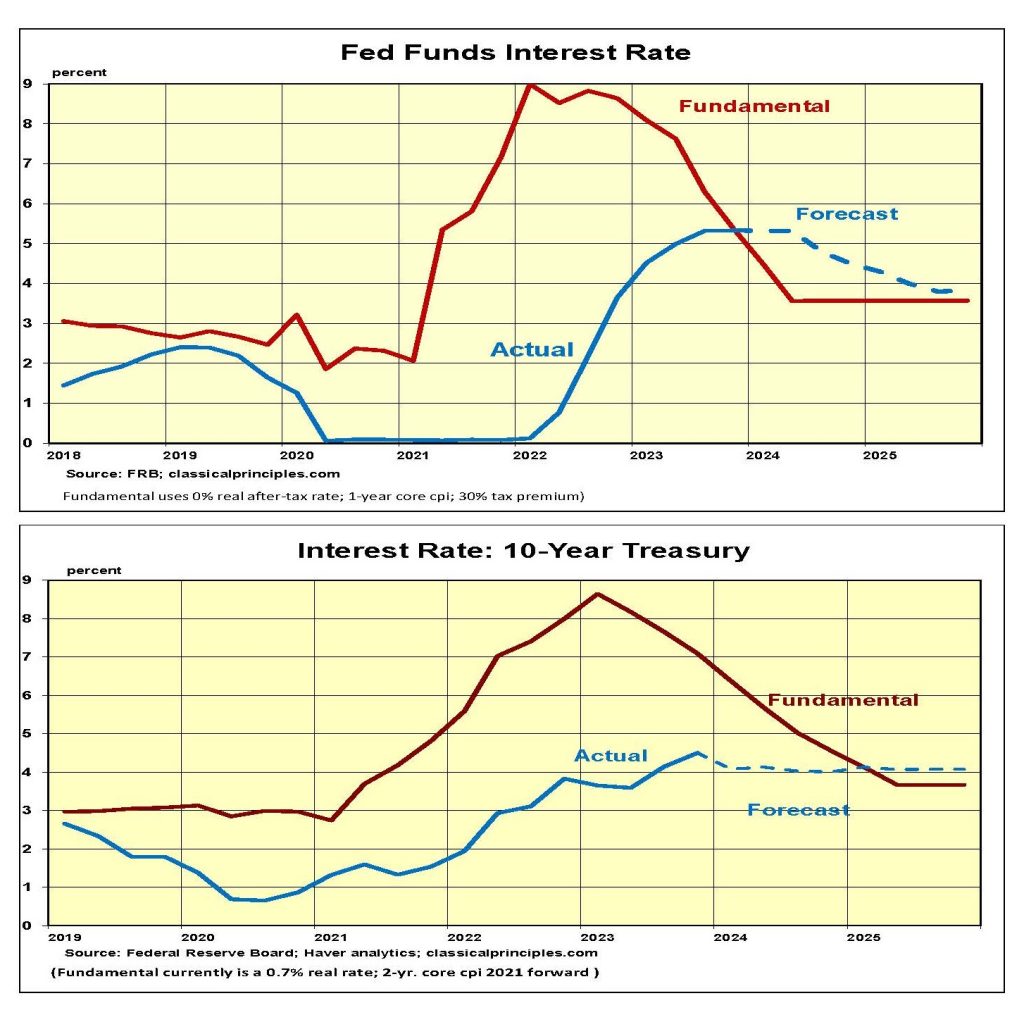
Interest Rates
Our measure of fundamental short- and long-term interest rates is based primarily on inflationary expectations. Currently the expectations are for falling rates in response to lower inflation.
Our fundamental forecast for the fed funds rate has moved below the actual rate. This implies a further policy tightening so long as the Fed keeps its target rate at its current level.
A similar analysis shows the fundamental yield on the 10-year T-Note relatively stable and in the vicinity of its recent level. We look for these rates to remain in the 3.5 percent to 4.5 percent range.
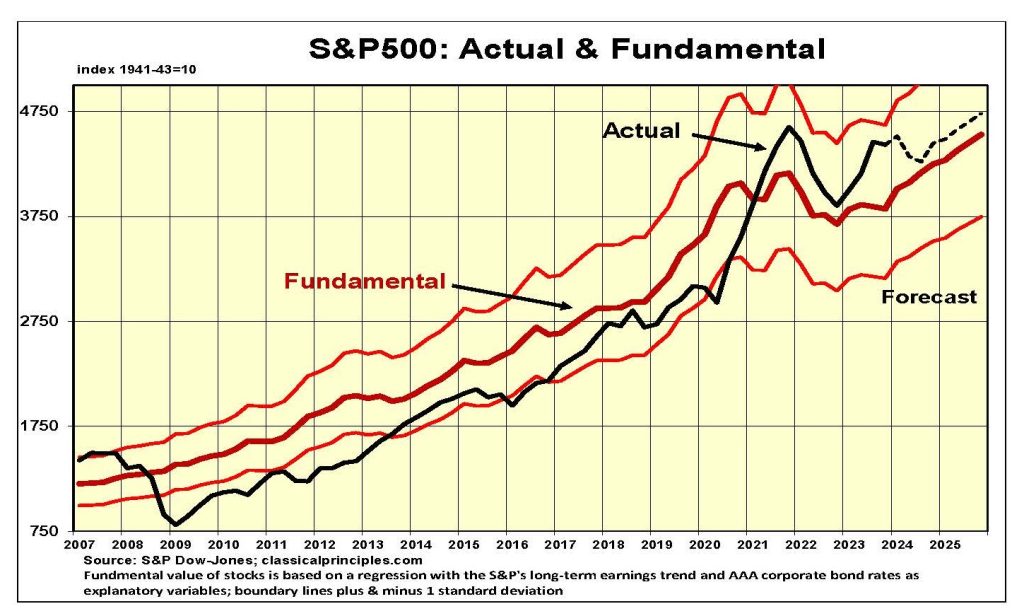
Stock Prices
Stock prices have ignored the progressively tighter monetary policy. As the economy continues to increase and inflation continues to slow, stock investors remain optimistic. They assume growth in the economy and profits will continue in 2024.
Our analysis forecasting a downturn in the economy and weakness in profits has not occurred. We believe that the economy has been weaker than the data suggest and that the delayed impact of monetary restraint has yet to appear.
Although our forecast calls for only a mild downturn in real growth, we believe the odds of a more dramatic decline are uncomfortably high. If the growth in money is close to zero or negative, and if the economy needs much faster growth in money to sustain it, there is a serious risk to the economy.
We long for the day when the monetary authorities pursued more-stable growth. The progressive increases in a highly erratic policy approach have distorted the relationship between money and the economy and among the various measures of money.
Although monetary factors may be a major negative for the future, there are a growing number of positive offsets. Bankruptcies amid electric cars and windmill companies and soaring costs for electricity provide powerful evidence of the waste from so-called green policies. The waste from politicians directing resources instead of relying on market forces is becoming painfully obvious.
As a result, the outlook for a major shift back to free-market, classical principles in 2025 is growing stronger each day.
For more great content from Budget & Tax News.
For more from The Heartland Institute.


")

