

YOU SHOULD SUBSCRIBE TO CLIMATE CHANGE WEEKLY.
IN THIS ISSUE:
- Official Temperature Data Isn’t ‘Data’ At All
- Video of the Week: This is hilarious! Is there nothing that climate change can’t do?
- Human Impact on the Carbon Cycle Is Minimal
- Islands Still Growing in the Midst of Climate Change
- Podcast of the Week: Save the Whales, Kill the Turbines – The Climate Realism Show #104
- Climate Comedy
- Recommended Sites
Watch ALL the Presentations by the ALL-STARS of Climate Realism at the Archive of Heartland’s 15 Climate Conferences

Official Temperature Data Isn’t ‘Data’ At All
Even before our first surface stations report in 2009, The Heartland Institute led the way in reporting on problems with the surface temperature record.
We have highlighted how the surface station record did not correspond to the temperatures recorded by global satellites and weather balloons, two alternative temperature data sources whose data sets closely track each other. Heartland has repeatedly exposed instances in both the United States and abroad where official agencies tamper with past temperature data at pristine stations, adjusting it to appear cooler than what was actually recorded, while adjusting recent temperatures upward. We were all over the adjustments made by corrupt NOAA scientists in 2015 before the Paris climate treaty negotiations—mixing data from unbiased ocean buoys with heat-biased temperature measurements taken from ships’ engine water intake inlets, which made it appear the ocean was suddenly warming faster than before.
Also, first, foremost, and most forcefully, we independently documented the serious problems with the official surface temperature record arising from the fact that the vast majority of temperature stations are poorly sited. Stations fail NOAA’s own standards for quality, unbiased stations in reporting temperatures skewed by the Urban Heat Island (UHI) effect.
My colleague, award-winning meteorologist Anthony Watts, in 2009, and then again, as a follow-up, in 2022, detailed with station location data and photographic evidence the problematic surfaces stations. Stations providing official data that were sited in locations where surrounding surfaces, structures, and equipment radiated stored heat or emitted heat directly biasing or driving the recorded temperatures higher than were recorded at stations in the same region, uncompromised by the well-known UHI (that is widely ignored by alarmists and official government agencies).
Of the sampling of hundreds of stations across the country Watts and his volunteer team documented in 2009, Watts wrote:
We found stations located next to the exhaust fans of air conditioning units, surrounded by asphalt parking lots and roads, on blistering-hot rooftops, and near sidewalks and buildings that absorb and radiate heat. We found 68 stations located at wastewater treatment plants, where the process of waste digestion causes temperatures to be higher than in surrounding areas.
In fact, we found that 89 percent of the stations—nearly 9 of every 10—fail to meet the National Weather Service’s own siting requirements …
The media and the government took notice of Watts findings, the latter producing official responses which admitted the problem, while claiming the temperature record, despite the gross violation of established rules for sound temperature data collection, was still valid and reliable.
Even while claiming “no harm, no foul,” the government shuttered some of the most egregiously sited stations highlighted in Watts’ report, and established an alternative temperature network, consisting only of unbiased stations, the U.S. Climate Reference Network (USCRN), consisting of new stations with state-of-the-art equipment sited in locations unlikely to ever be impacted by the UHI. The temperature data set from the USCRN, for anyone who cares, displays about half the warming and a slower rate of warming than the broader U.S. Historical Climate Network (USHCN) used by the government in its official reports claiming unprecedented warming. In fact, the data from the relatively few well-sited, unbiased USHCN stations, when compared to the network as a whole, also show half the warming reported by the government. The government has good data, it just doesn’t report or count it as official.
Simultaneously, the government added thousands of previously uncounted temperature stations maintained by various agencies and private parties to the official network—existing stations added without any quality control.
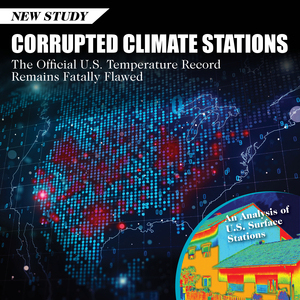
The result of the latter effort was predictably disastrous from the perspective of producing a high quality, trustworthy record of surface temperatures uninfluenced by the UHI. Watts’ follow-up report, based on an investigation conducted in 2022, found that the record was now even worse. Watts and his team of volunteers documented with location data and photographs a sample of 128 stations across 11 states. (I traveled to and documented five stations in North Central and East Texas myself.) They found, as reported in a summary of the study:
Of the 128 stations surveyed, only two were found to be Class 1 (best-sited) stations: Dubois, the Idaho Agricultural Experiment Farm, and the Louisiana Agricultural Experiment Farm. Just three stations were found to be Class 2 (acceptably sited), while the remaining 123 stations were found to be Class 3, 4, and 5, and therefore considered unacceptably sited.
“With a 96 percent warm-bias in U.S. temperature measurements, it is impossible to use any statistical methods to derive an accurate climate trend for the U.S.,” said Heartland Institute Senior Fellow Anthony Watts, the director of the study. “Data from the stations that have not been corrupted by faulty placement show a rate of warming in the United States reduced by almost half compared to all stations.”
Now, an investigative report by Katie Spence, a journalist at The Epoch Times, exposes an additional problem with the U.S. surface temperature record—a failing, if anything, even more egregious than the issues I’ve discussed so far: many “stations” allegedly “reporting” temperatures, don’t actually exist anymore, and haven’t for years. The government is just making up the data reported from many locations based on an averaging of temperatures recorded at other locations in the region. Describing the situation, The Epoch Times writes:
When recalling past temperatures to make comparisons to the present, and, more importantly, inform future climate policy, officials such as [United Nations secretary-general António] Guterres and President Biden rely in part on temperature readings from the United States Historical Climatology Network (USHCN).
The network was established to provide an “accurate, unbiased, up-to-date historical climate record for the United States,” NOAA states, and it has recorded more than 100 years of daily maximum and minimum temperatures from stations across the United States.
The problem, say experts, is that an increasing number of USHCN’s stations don’t exist anymore.
And it’s not just a few missing stations providing made-up numbers. said Lt. Col. John Shewchuk, a certified consulting meteorologist, who was interviewed by Spence for the story. He reported that:
USHCN stations reached a maximum of 1,218 stations in 1957, but after 1990 the number of active stations began declining due to aging equipment and personnel retirements.
NOAA still records data from these ghost stations by taking the temperature readings from surrounding stations, and recording their average for the ghost station, followed by an “E,” for estimate.
“NOAA fabricates temperature data for more than 30 percent of the 1,218 USHCN reporting stations that no longer exist,” [said Shewchuk.] “They are physically gone—but still report data—like magic, …”
With his hands-on experience tracking the surface stations, Watts was consulted for the report, as well. As The Epoch Times investigative journalists write, he told them:
The addition of the ghost station data means NOAA’s “monthly and yearly reports are not representative of reality,” said Anthony Watts, a meteorologist and senior fellow for environment and climate at the Heartland Institute.
“If this kind of process were used in a court of law, then the evidence would be thrown out as being polluted.”
Temperature data from compromised biased stations, temperatures reported from non- existent ghost locations, temperature data adjusted or homogenized to fit a narrative, and independent sources of data from the surface (USCRN), satellites, and weather balloons, that report much less warming than recorded at the compromised, adjusted, and now evidently non-existent stations: it leads one to question why anyone should trust the official government reports on rapidly rising, regularly record-setting temperatures. Such fake data wouldn’t stand up to scrutiny in a court of law. It surely shouldn’t be relied upon to drive public policies limiting the freedom of billions of people in their personal and economic lives.
Sources: The Epoch Times; The Heartland Institute; The Heartland Institute
NEW: Get Climate at a Glance on your mobile device!

Video of the Week
This is hilarious! Is there nothing that climate change can’t do? It apparently harms Indonesian trans sex workers hardest.

Read the brutal truth about how battery production for electric vehicles cause immense environmental destruction and human tragedy.
Human Impact on the Carbon Cycle Is Minimal
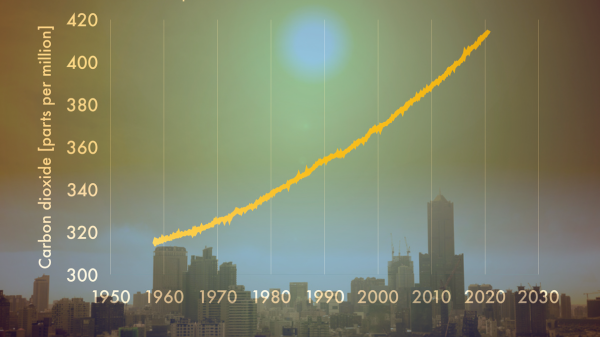
A recent study published in the journal Sci discusses a series of studies that have concluded rising carbon dioxide levels are a response to warming, rather than the cause of it. The author of the paper then proceeds to confirm this with his own analysis.
Demetris Koutsoyiannis, professor emeritus in the Department of Water Resources and Environmental Engineering at the National Technical University of Athens, reviews the findings of a several recent studies published across multiple journals, including studies in which Koutsoyiannis was a co-author, which “questioned the conventional wisdom that increased atmospheric carbon dioxide concentration” is driving temperatures higher. The first papers in that series of studies undertook statistical analyses of the instrumental record over the past 70 years and concluded that changes in temperatures have preceded increases in atmospheric CO2 concentrations. The later studies analyzed the carbon cycle to confirm the conclusions of the earlier research, and also determined that “the natural [CO2] changes due to temperature rise in the last 65 years are far larger (by a factor > 3) than human emissions, while the latter are no larger than 4% of the total.”
The new paper examines specific types of stable carbon isotopes to determine how the signature of carbon dioxide isotopes emitted by humans have shifted over time, how they are mixing with other isotopes, and what their impact has been on the overall carbon cycle and temperatures. Koutsoyiannis’ isotopic analysis from four observation sites led him to conclude improved carbon uptake is not being accounted for in models claiming CO2 increases are driving temperature changes, and that:
the standard metric δ13C is consistent with an input isotopic signature that is stable over the entire period of observations (>40 years), i.e., not affected by increases in human CO2 emissions. In addition, proxy data covering the period after 1500 AD also show stable behavior. These findings confirm the major role of the biosphere in the carbon cycle and a non-discernible signature of humans.
Source: Sci
Heartland’s Must-read Climate Sites


Islands Still Growing in the Midst of Climate Change

New research confirms what previous research has shown, that, on average, island land mass has been expanding during the recent period of sea level rise, rather than islands sinking beneath the waves as climate scolds, and island governments (would-be recipients of reparations and climate mitigation funds), have been claiming.
The new paper, published in the International Journal of Digital Earth, begins with the observation that “the field of island studies is often hampered by a lack of data and inconsistent methodologies, leading to an inadequate understanding of the processes driving shoreline changes on islands within the context of climate change.”
To remedy this gap in observational knowledge, the team of researchers, from various universities and research institutes in China, used remote-sensing data covering more than 13,000 islands in Southeast Asia, the Indian Ocean, and the Mediterranean Sea, from 1990 to 2020.
About 12 percent of the islands experienced significant or measurable shoreline shifts during the period, both erosion and expansion. Although the study found that land was lost during the 1990s, overall, during the 30-year period, the islands studied experienced a net increase of 157.21 km2.
Importantly, the research found that natural factors had “comparatively minor impact[s]” on the expansion or contraction of island shores and land mass as a whole. The dominant driver of the changes were human development activities, particularly reclamation and land filling.
Even ongoing sea level rise (whether natural or anthropogenic) proved to be at most “an exacerbating factor for coastal erosion rather than the primary cause.”
The study’s authors suggest that to maintain islands’ integrity and their inhabitants’ well-being, islands focus efforts on various types of adaptation measures to the myriad factors that contribute to shore erosion. Well-designed, constructed, and maintained sea walls are already proving valuable in this regard. Other adaptive options the authors suggest include, for example, maintaining existing wetlands, mangroves, seagrass beds, and coral reefs, and restoring those same features when they’ve been degraded or destroyed. In addition, developing sustainable freshwater infrastructure to avoid draining aquifers which can lead to subsidence, sink holes, and salt-water incursion.
Sources: Climate-Science Press; International Journal of Digital Earth
Podcast of the Week
On episode 104 of The Climate Realism Show, we explain that to save the whales we need to kill these growing large-scale offshore wind projects. These so-called “wind farms” are much larger and do much more environmental damage than most people realize. Covering an area the size of Connecticut and Rhode Island combined, one project off the Mid-Atlantic poses an existential risk to the critically endangered North Atlantic right whale.
That is just one of many ocean mammals harassed and killed by these projects that will, at best, provide unreliable and expensive energy. Remember when “save the whales” was the cry of the environmentalists? Now they are fine with a spike in dead whales washing up on our Atlantic beaches as long as the “green energy” agenda continues apace.
Subscribe to the Environment & Climate News podcast on Apple Podcasts, iHeart, Spotify or wherever you get your podcasts. And be sure to leave a positive review!
Climate Comedy
Recommended Sites


")


H. Sterling Burnett has, in recent months, changed from the most reliable climate writer I knew of, to one whose articles I reject for my blog’s daily recommended reading list.
This article is rejected for the false statement below:
“The temperature data set from the USCRN, for anyone who cares, displays about half the warming and a slower rate of warming than the broader U.S. Historical Climate Network (USHCN) used by the government in its official reports claiming unprecedented warming. In fact,” H. Sterling Burnett
This is the opposite of the truth
NOAA’s USCRN reflects faster global warming than nClimDiv, (+0.34 degrees C. for USCRN versus +0.27 degrees C. for nClimDiv, both from 2005 through 2023). NClimDiv was the official US average used for the GAT since 2014.
A more recent trend from, 2005 through early 2024, was +0.34 degrees C. per decade warming since 2005. That happens to be more than double the +0.15 degree C. GLOBAL warming from the latest UAH dataset. Meaning +0.34 is a big deal. USCRN for the US reflects a warming rate similar to the average CMIP6 model warming rate for “CAGW” global warming. So I guess we have had “CAGW” in the US since 2005 and no one noticed?
Here’s what this website claims about USCRN on the home page:
“The US Climate Reference Network record from 2005 shows no obvious warming during this period.” WUWT website home page
This is a deception
I am tired of hearing conservatives criticizing USHRN or ClimDiv and then claiming USCRN is accurate.
That’s not logical
If you do not trust NOAA, and I do not, then you should not assume some of their numbers are accurate and other numbers are biased.
Either you trust the organization, or you don’t. I don’t.
Did NOAA improve the siting of the USHRN stations after the 2009 report? No. The siting appeared worse by 2016. So I do not trust NOAA. They do not even try to create the illusion of improving their science.
nClimDiv, according to NOAA
Altogether, nClimDiv incorporates data from more than 10,000 stations. These stations are spread among 357 climate divisions in the contiguous 48 states and Alaska.
https://honestclimatescience.blogspot.com/