How’s America doing? Government statisticians provide mounds of data that provide useful clues, and none more so than the Census Bureau’s estimates of population, announced in the holiday weeks at the end of each calendar year. The latest numbers measure the estimated population of each state as of last July 1 as compared to the constitutionally required decennial census dated April 1, 2020.
These dates thus cover 39 months, almost exactly one-third of a decade, and in this case, date from the imposition of COVID lockdowns. They have the advantage of covering a unique period, and the disadvantage is that there is some doubt about the accuracy of the April 2020 census.
Readers familiar with the narrative of Sun Belt population gains and Snow Belt population losses will find some surprises in the results. In the Mountain West, chilly Idaho and Montana had percentage gains greater than in sunny Arizona and Nevada; Idaho’s 6.8% gain was the largest in the nation. And Maine and New Hampshire had robust gains, just as northern New England did in the inflationary 1970s (do people seek wood stoves when prices rise?).
These are minor changes. Three major developments stand out much more, each unique to this 39-month period.
1. The three largest metropolitan areas had the largest population losses, in percentages and absolute numbers. California’s population declined by 573,000 (all figures rounded off for clarity), Illinois’ by 264,000, New York’s by 631,000. In percentage terms, the tiny District of Columbia and isolated Hawaii rivaled these losses.
The picture you get is people fleeing COVID restrictions, empty offices and high taxes needed to support lavish public pensions. Expensive and dysfunctional government is a hard sell.
This wasn’t just a regional problem, by the way. The Northeast outside New York state gained 35,000 people, and the Midwest outside Illinois gained 185,000.
2. The South accounted for almost all the nation’s population gains — and more. The Southern states — which I define as the 11 Confederate states plus West Virginia, Kentucky and Oklahoma — gained 3,822,000 people in the 39 COVID and post-COVID months. That’s more than the nation’s population gain, thanks to the losses in New York, California and Illinois.
The Southern states’ lower taxes, lighter regulation and lesser imposition of “woke” policies have helped it attract internal migrants and encourage family formation.
Texas had the largest population gain in 2020-23 (1,357,800), but Florida was not far behind (1,073,000), and the South Atlantic states from Florida north to Virginia accounted for most of the South’s gain (2,123,000), 62% of the national total. Mid-20th-century demographers saw the New York-centered “megalopolis” as the focus of dynamic national growth. Now it’s Interstate 95 south of Richmond.
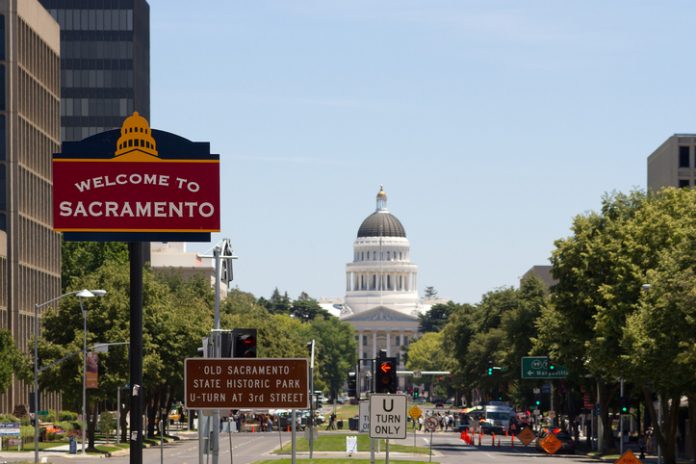
3. The Pacific Rim is shrinking. Just as startling as the South’s gigantic share of the nation’s population gain is the fact of absolute population shrinkage of the Pacific states. California, which gained population every year since the Gold Rush of 1849, has lost 573,000 people in the 39 months since April 2020. Hawaii and Oregon have lost people, too; Alaska has gained only 32 (people, not percent), while Washington has gained just 108,000.
There’s a parallel here with what has been happening demographically on the other side of the Pacific Ocean. Japan’s population has been declining, and this historically xenophobic nation has now been admitting immigrants if only to tend to its increasingly elderly population.
South Korea, whose dynamic economic growth since the 1950-53 war has been quasi-miraculous, has one of the lowest fertility rates on earth, and the end of China’s one-child policy in 2016, after nearly 40 years in place, has not resulted in a significantly higher birth rate.
Not so long ago, both sides of the Pacific Rim were seen as the wave of the future, producing outsize shares of world innovation and growth. But population growth seems to have halted there, with little prospect of resuming, and an older and shrinking workforce seems unlikely to produce innovations at anything like the pace once predicted.
COVID and the varying responses thereto seem to have accentuated and exaggerated preexisting demographic trends in this country and perhaps in others as well. These 39 months have seen a startlingly large share of national growth in the South and Mountain states — once the nation’s economic laggards and backwaters.
Even more surprising is the perhaps temporary rush from the nation’s largest metropolitan areas and the almost entirely unpredicted population shrinkage in climatically favored California and the Pacific Rim — trends explicable only as the result of dreadfully destructive public policies.
Michael Barone is a senior political analyst for the Washington Examiner, resident fellow at the American Enterprise Institute and longtime co-author of The Almanac of American Politics. His new book, “Mental Maps of the Founders: How Geographic Imagination Guided America’s Revolutionary Leaders,” is now available.
COPYRIGHT 2023 CREATORS.COM
For more Rights, Justice, and Culture News.
For more public policy from The Heartland Institute.


