Banks have offset the Federal Reserve’s money-tightening efforts in recent weeks.
The Atlanta Fed currently estimates second-quarter real growth was 3.6 percent. My recent article on Why Living Standards Decline as the Economy Appears to Grow explains the disconnect between lower living standards and the appearance of a growing economy. When government policies dictate the flow of resources, statistics fail to measure the extent of waste and the resulting decline in living standards.
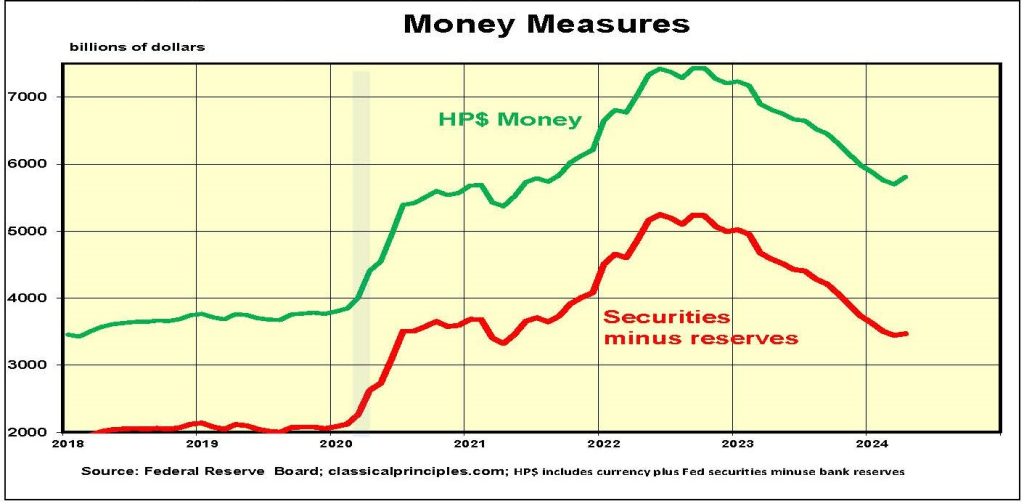
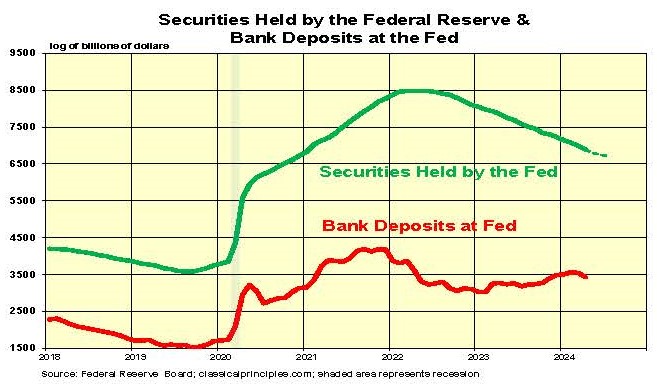
From mid-2021 to mid-2022, the Fed purchased $1½ trillion in securities. By flooding the economy with money, this irresponsible action created our serious inflation problem.
To contain the inflation it created, the Fed reversed its policy and sold $1½ trillion. Selling securities removes money from the economy. As money and credit become less available, interest rates rise and the economy slows.
Current-dollar spending (GDP), soared to 17 percent in the year ending in the spring of 2021. It has since slowed to 5 percent over the past year. The slower pace of spending brought inflation down from 7 percent in 2022 to just under 4 percent in this past year.
We criticized the Fed for putting too much money in the economy, but praise them for taking the money back out. We remain concerned that the lagged effects of the Fed’s monetary restraint may yet send the economy into a downturn.
Monetary Indicators
One reason for confusion over the likely impact of the Fed’s current policy is its interest rate target. The Fed dictates its target instead of allowing financial markets to determine the rate.
When the Fed’s target differs significantly from a market rate, serious problems can occur. For example, beginning in 2020, the Fed’s target was too low. To meet its target the Fed created too much money, producing the highest inflation in 40 years.
The opposite mistake occurred in 2008 when the Fed set its target rate too high. This led the Fed to sell large amounts of securities, which produced the Great Recession, the worst financial crisis since the Great Depression.
The Fed believes its current target rate is appropriate. If so, monetary policy will guide the economy to a relatively stable adjustment to lower inflation.
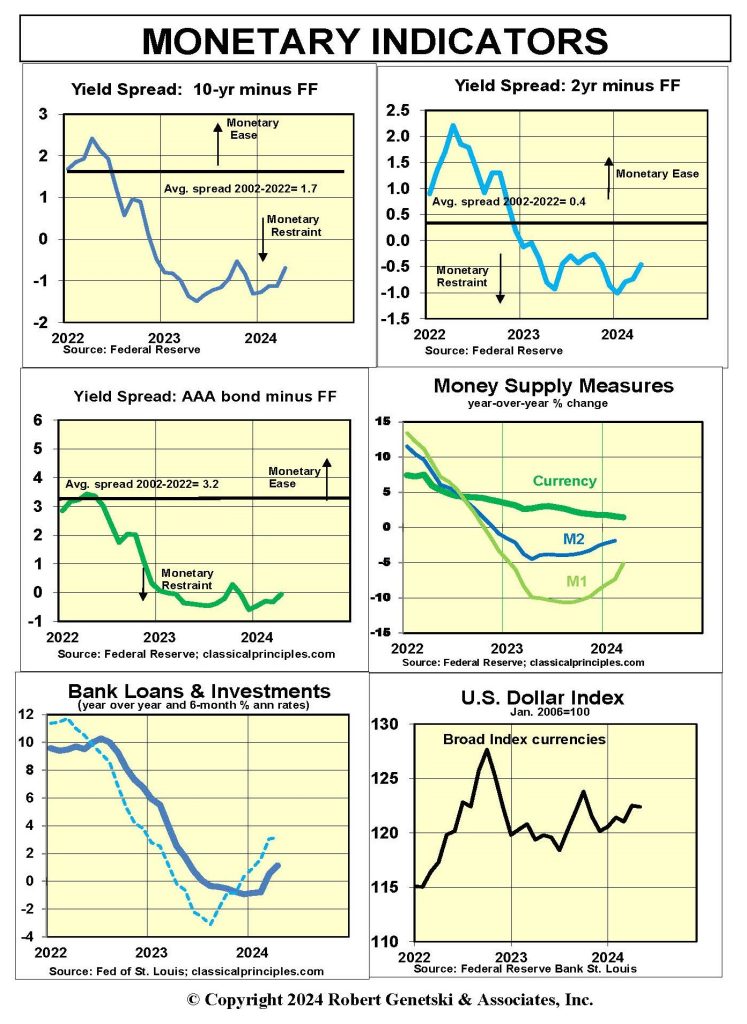
Certain monetary indicators, such as inverted yield curves and traditional money supply measures, suggest monetary policy may be too restrictive. If this is correct, the Fed should not be selling securities.
For the first time in more than a year, our measure of the monetary base did not decline in April. Although the Fed sold $95 billion in securities to tighten money, banks offset the impact by shifting $121 billion from their deposits at the Fed and put the funds into the economy. This resulted in a net increase of $26 billion in the raw money supply, negating the Fed’s tightening.
There are also tentative signs in traditional money measures that money has become less restrictive. The charts below show year-over-year changes in money have become less restrictive. Traditional measures of money have been more stable in the six months ending in April. There also has been a recent increase in bank loans and investments.
With the Fed planning to moderate its sales of securities beginning in June, there is a growing likelihood that the period of monetary restraint that began a year and a half ago is nearing an end.
The lag between tighter money and its impact on the economy still can create further problems later this year. However, the good news is that with the removal of a large part of the excess money, we are closer to the end of such problems than a year ago.
Sensitive Indicators
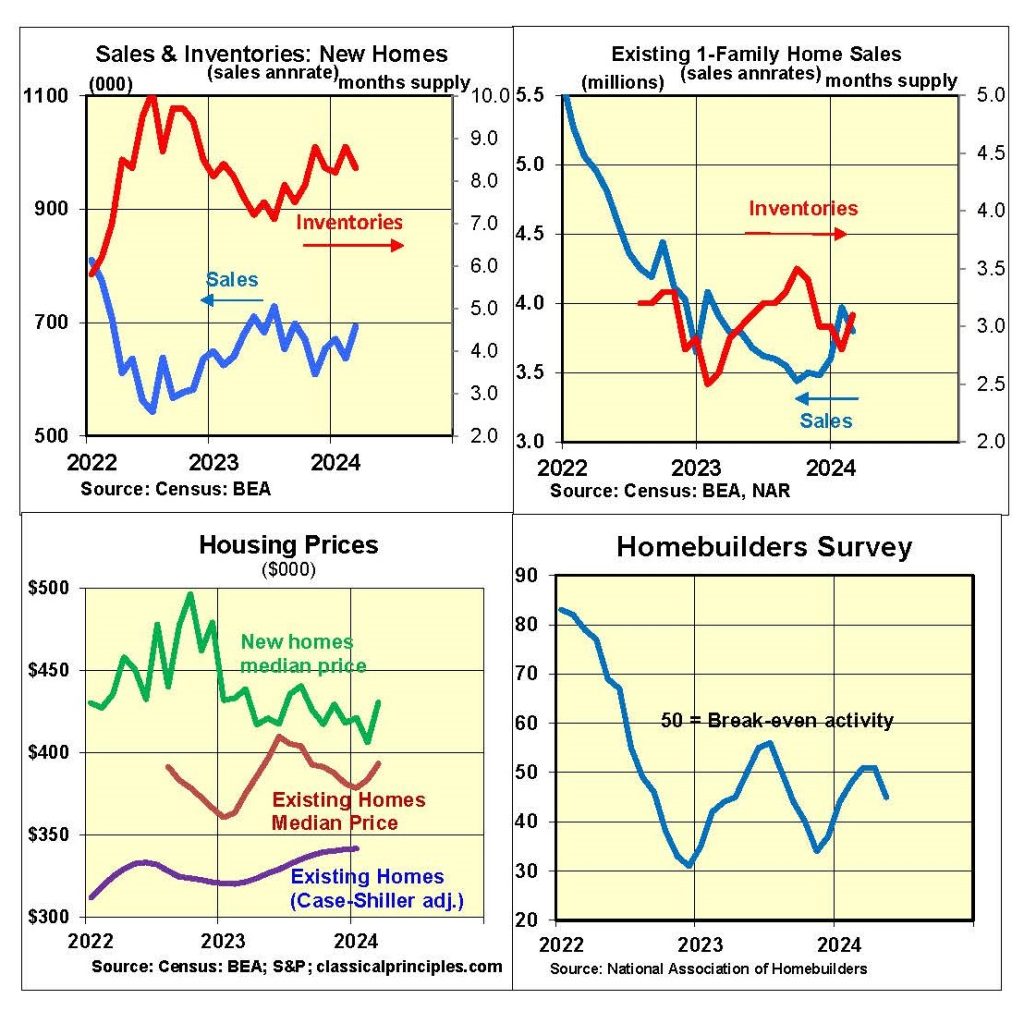
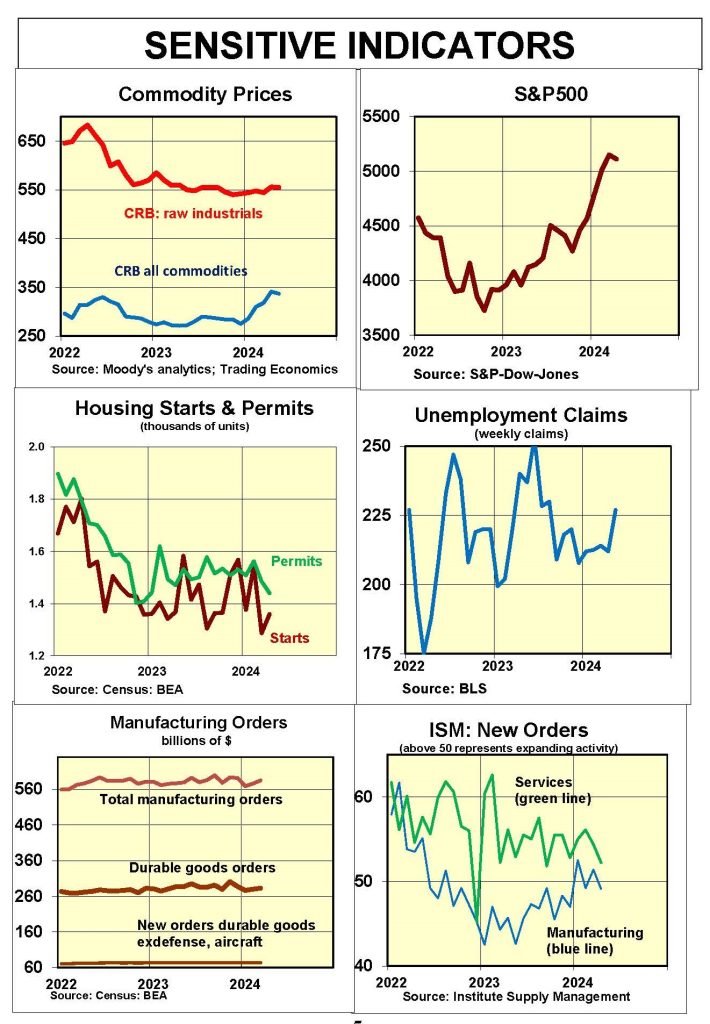
Sensitive indicators remain mixed. Housing activity shows signs of stabilizing. The median prices for new homes remain somewhat depressed because of high inventories, while prices for existing homes moved higher because of a lack of inventories.
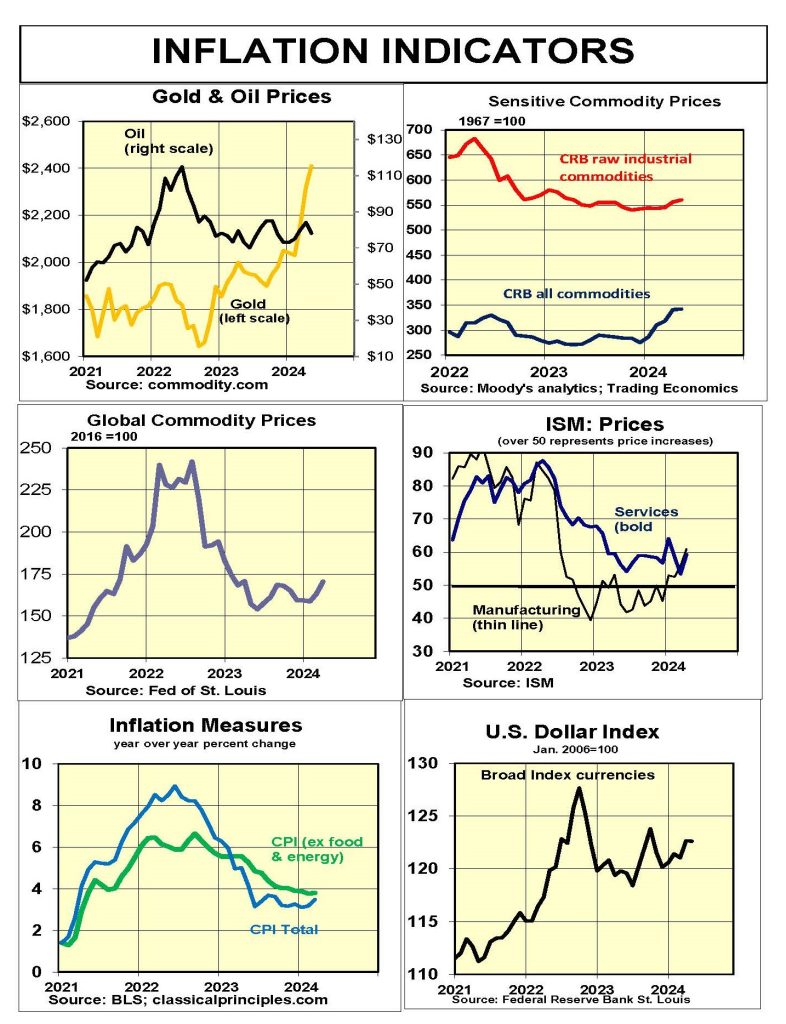
Raw industrial commodity prices recently moved moderately higher, creating problems for any near-term lowering of interest rates.
New orders for manufacturing have been flat to down, and the ISM April survey also points to weakness.
The stock market, by contrast, continues to advance, pointing to investor confidence that the economy and corporate profits will remain strong.
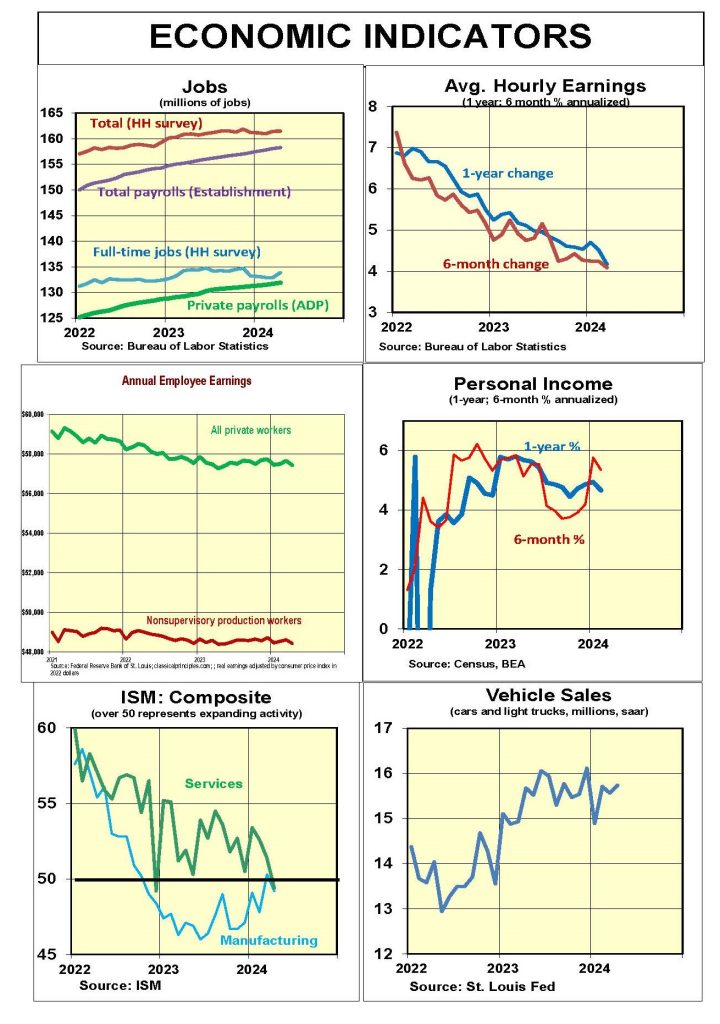
Most coincident indicators show the economy continued to expand into the spring. However, the April ISM business composite survey shows both manufacturing and service sectors in a slight decline, the first decline for the service sector in over a year.
Inflation Indicators
Inflation continues to moderate, albeit slowly. With current dollar spending increasing faster, our estimate of the underlying or fundamental inflation is 4 percent.
The core CPI is 3.6 percent year-over-year. However, in both the three- and six-month periods ending in April, inflation is up at just over a 4 percent annual rate, consistent with our calculation of the fundamental rate.
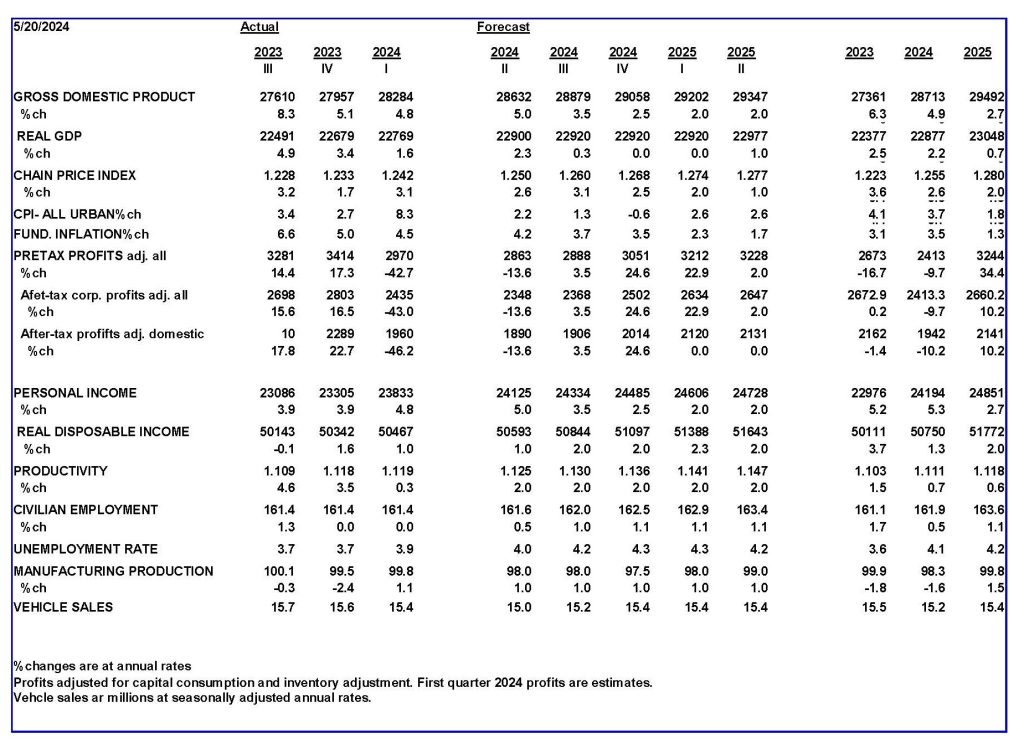
Our analysis projects the fundamental inflation rate will decline to the 2 percent to 3 percent vicinity by year-end. This decline is based on our assumption that current-dollar spending will slow considerably, going down to a 2 percent to 3 percent annual rate by the fourth quarter.
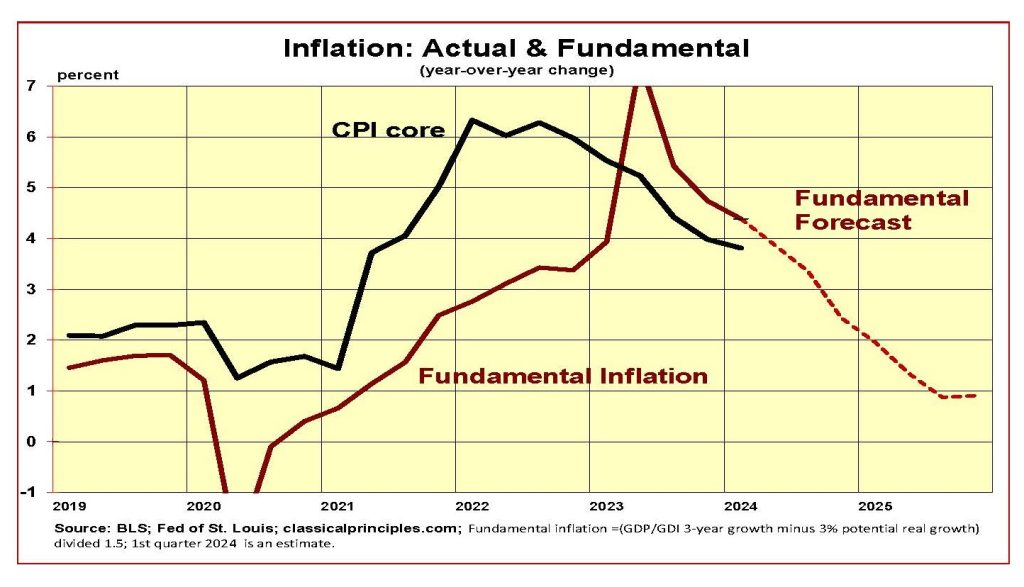
The persistence of relatively strong rates of spending and inflation, along with the recent upturn in commodity prices, will postpone any Fed interest rate cuts until late this year, if then.
Interest Rates
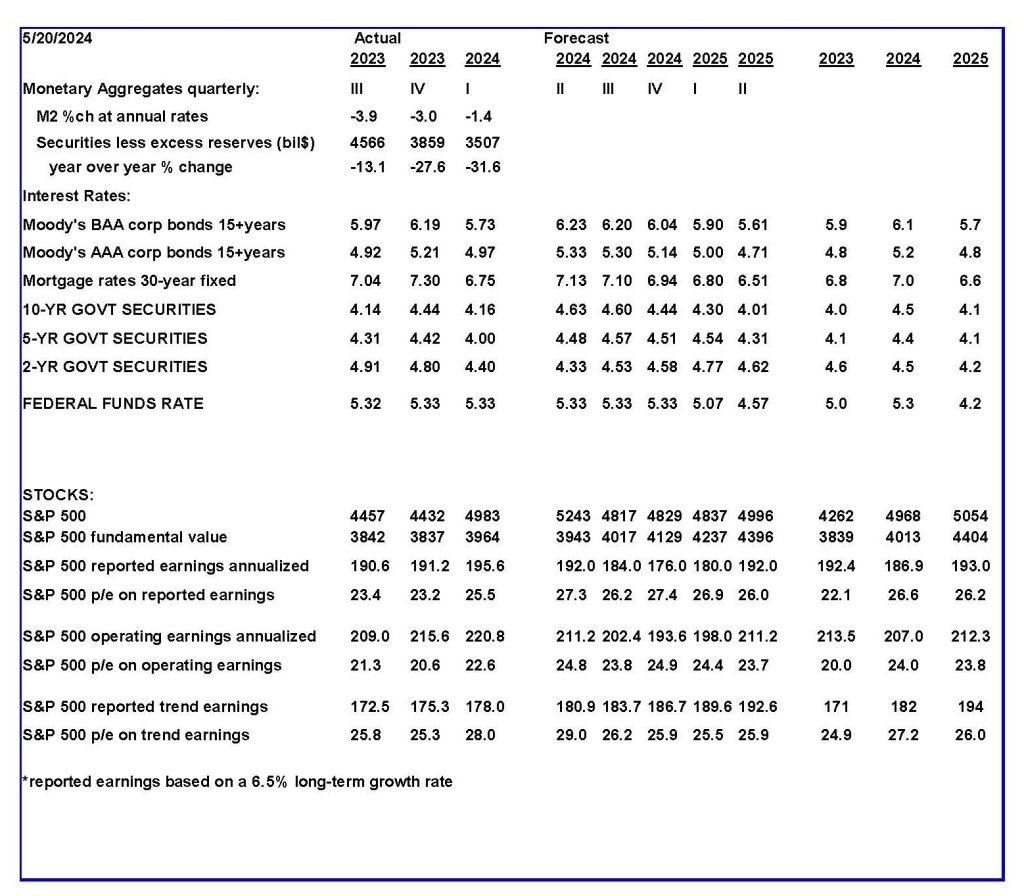
Continued strong growth in spending and inflation have led financial markets to push back the expected timing of any interest rate cut. Financial market expectations for a rate cut as early as September are in response to recent signs of a slowdown. We forecast persistent signs of inflation will delay any rate cuts until year-end.
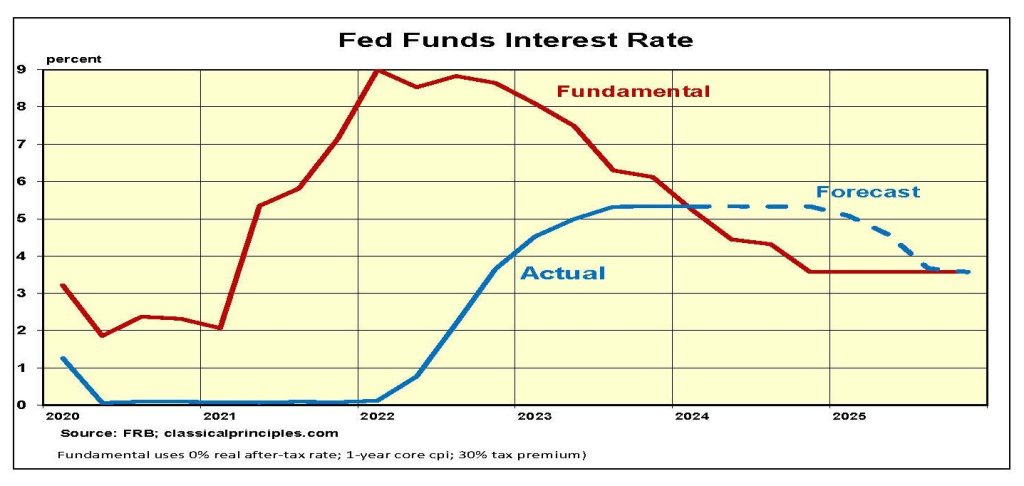
The chart below shows our forecast of the fundamental fed funds market rate moving below the Fed’s interest rate target. The Fed believes policy is restrictive and is prepared to cut interest rates as soon as inflation is contained.
A similar analysis of the fundamental yield on the yield on 10-year T-Notes shows it gradually moving towards 4 percent by early 2025, and is reflective the current 4.4 percent yield.
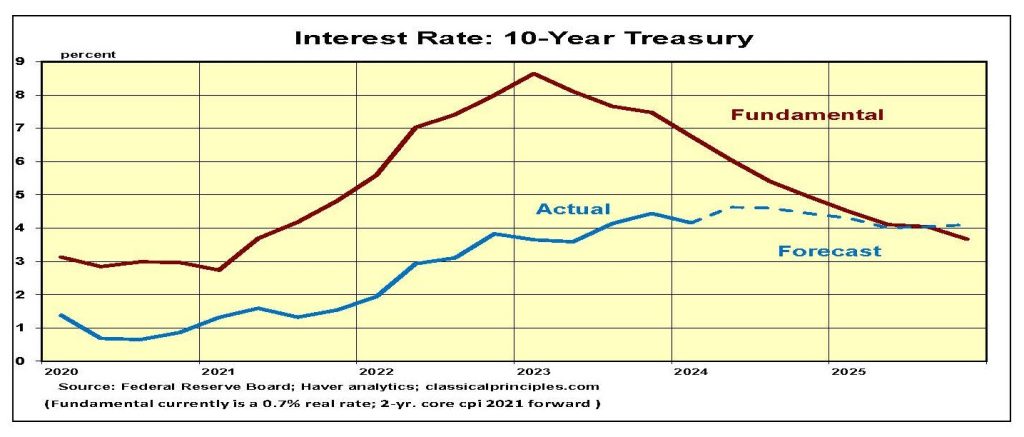
The speed at which longer-term rates decline depends on the market’s perception of the Fed’s commitment to reaching its inflation target. We expect the Fed’s inflation-fighting resolve will keep the 10-year Treasury heading gradually toward the 4 percent vicinity for the coming year.
Stock Prices: S&P500
Strong first quarter S&P500 earnings reinforced investor confidence about the upward trend in stock prices. With almost 90 percent of S&P500 companies reporting, first quarter annualized reported profits were $195.60 a share, 10 percent above their longer-term trend. Operating profits were $220.80, 24 percent above the longer-term profits trend.
Our S&P500 stock market model uses the Index’s long-term reported profit trend instead of actual profits. For the second quarter of 2024, trend profits are $181 a share. The use of trend profits is a conservative approach to estimating the market’s value.
Our stock market model also uses the current AAA bond rate, currently 5.2 percent, to calculate a fundamental value for the S&P500. For the second quarter of this year its value is 4000. With the S&P500 at 5300 the market is currently 33 percent overvalued.
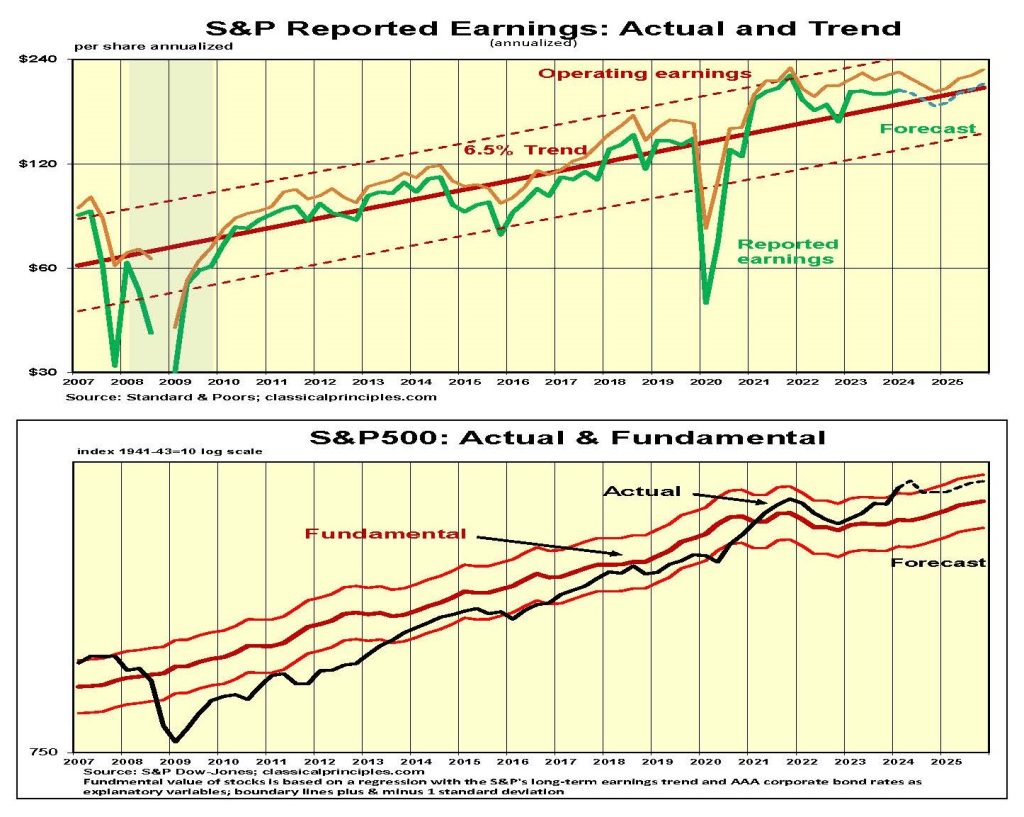
We continue to believe stocks are vulnerable, particularly if tentative signs of a slowdown become more apparent. However, the impressive ongoing strength in profits along with a potential a shift back to classical economic principles in 2025 raises the odds that any downturn in stock prices will be limited.
For more great content from Budget & Tax News.
For more great content from Budget & Tax News.


