


By Robert Genetski
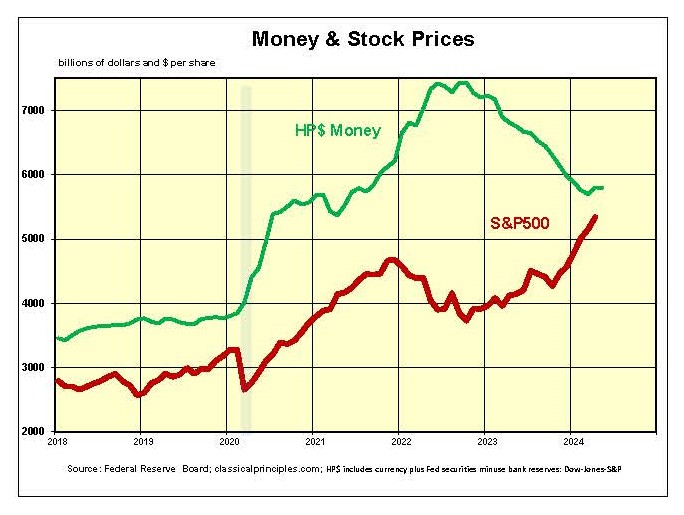
Though the Fed kept short-term rates stable for the past year, monetary policy has been far from stable. Instability began in the second half of 2020 amid the Fed’s surge in purchases of securities to finance Covid spending.
This resulted in a sharp increase in both high-powered money and M2 money. By early 2021, GDP spending peaked at 17 percent, fueling soaring inflation.
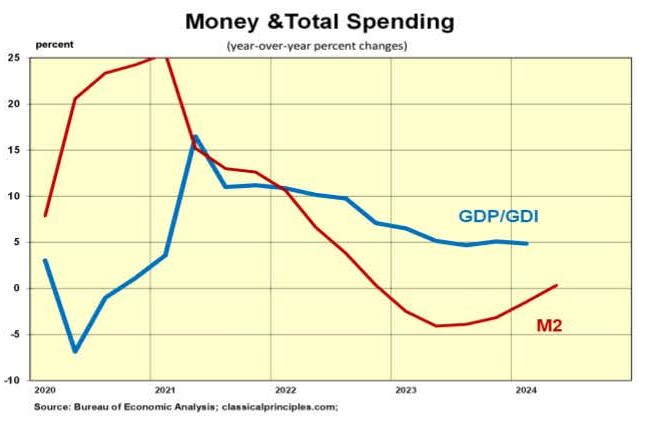
Although GDP spending was booming throughout 2022, the Fed purchased yet more large quantities of securities to finance President Joe Biden’s spending programs. This tsunami of purchases of securities kept spending and inflation high.
The following chart shows the Fed reversing and beginning to sell securities in late 2023 in an effort to slow both spending and inflation. Sales of securities reduced high-powered money (HP$) which consists of currency plus Fed holdings of securities less bank deposits at the Fed.
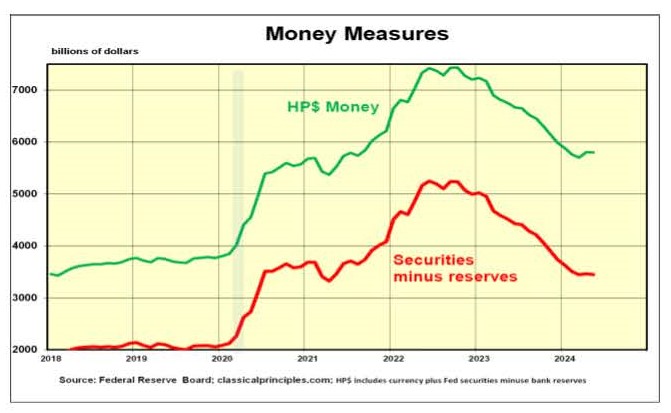
HP$ is the main money supply, supporting all other measures of money. As the above chart shows, the Fed’s holdings of securities less bank deposits at the Fed are often the driving force for changes in other money supply measures.
The Fed’s excessive purchases of securities are the root cause of recent high inflation. Having provided the fuel to ignite the inflation fire, the Fed turned to selling securities to reduce the problem it had created.
Ideally, the Fed hoped to pour enough water on the economy to contain the inflation fire without creating a downturn. Although history shows the odds are against the Fed achieving its objective, recent developments suggest the odds are improving.
April and May showed tentative signs that money had become less restrictive. If the economy continues to grow in the months ahead while money indicators turn more positive, the Fed will succeed in its objective of removing excess money without creating an economic downturn. An analogy would be an arsonist setting a building on fire and then putting out the fire to limit the damage.
Monetary Indicators
The Fed’s increasingly erratic monetary behavior has changed the relationship between high-powered money and M2, and also the relationship between these measures of money and the economy.
The following table shows that from the end of 1999 to the end of 2007 various measures of money and GDP spending were very close to each other. However, from the end of 2007 to the end of 2019, the relationship changed. GDP growth was much slower than the growth in money supply measures. The same pattern is also apparent after 2019, as the Fed’s manipulation of money became even more erratic:
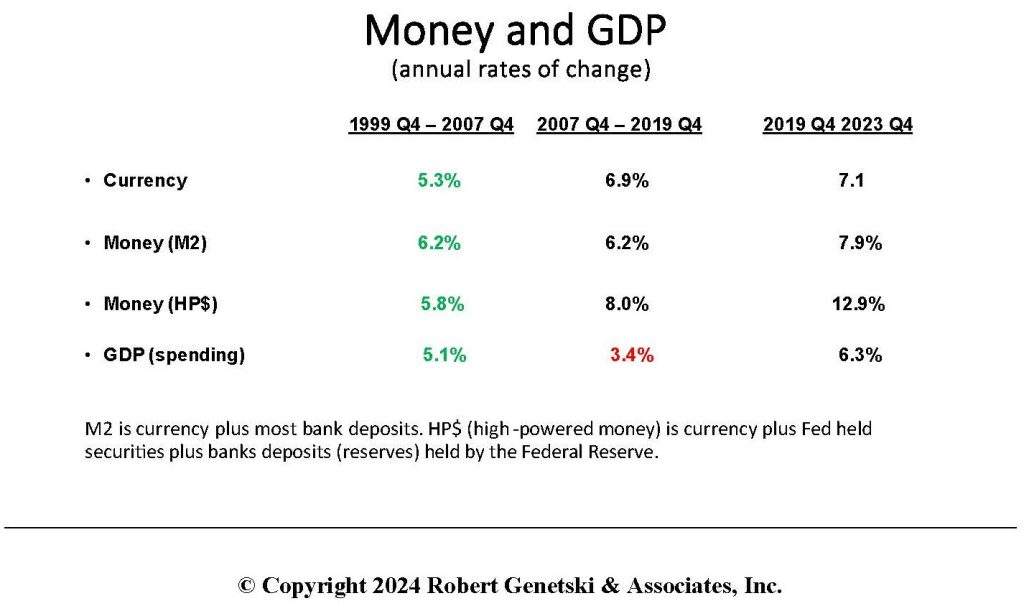
Since 2019, the Fed has to create far more high-powered money than before to influence the amount of currency and M2. It is also notable that the M2 money measure, which had become unrelated to changes in GDP from 2007 to 2019, once again became more closely related to GDP changes.
Our charts of monetary indicators reinforce the tentative improvement in recent monetary developments. Though yield curves remain inverted, they have become slightly less so in recent months. Also recently, both the yearly changes in M2 and bank loans and investments have turned positive.
With gradual signs the money supply is no longer declining, the odds of a transition to low inflation without a recession have improved.
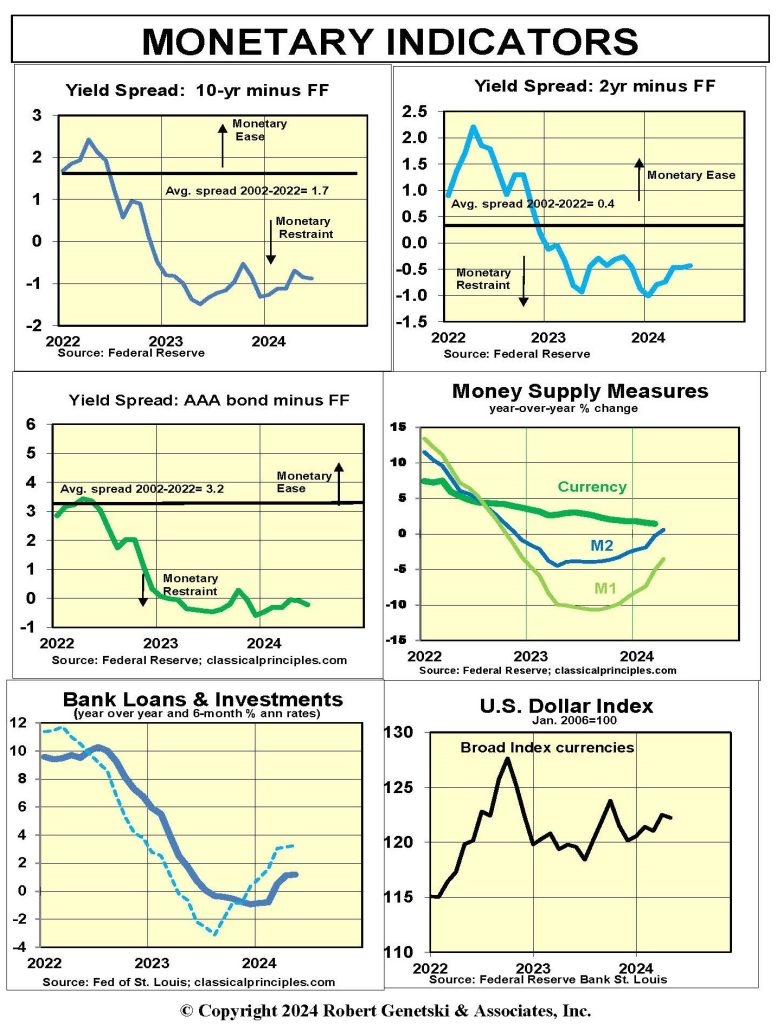
The bad news. The lag between tighter money and its impact on the economy still can create problems later this year. However, the good news is that the Fed’s removal of a large part of the excess money it had created shows we are closer to the end of such problems than we were a year ago.
Sensitive Indicators
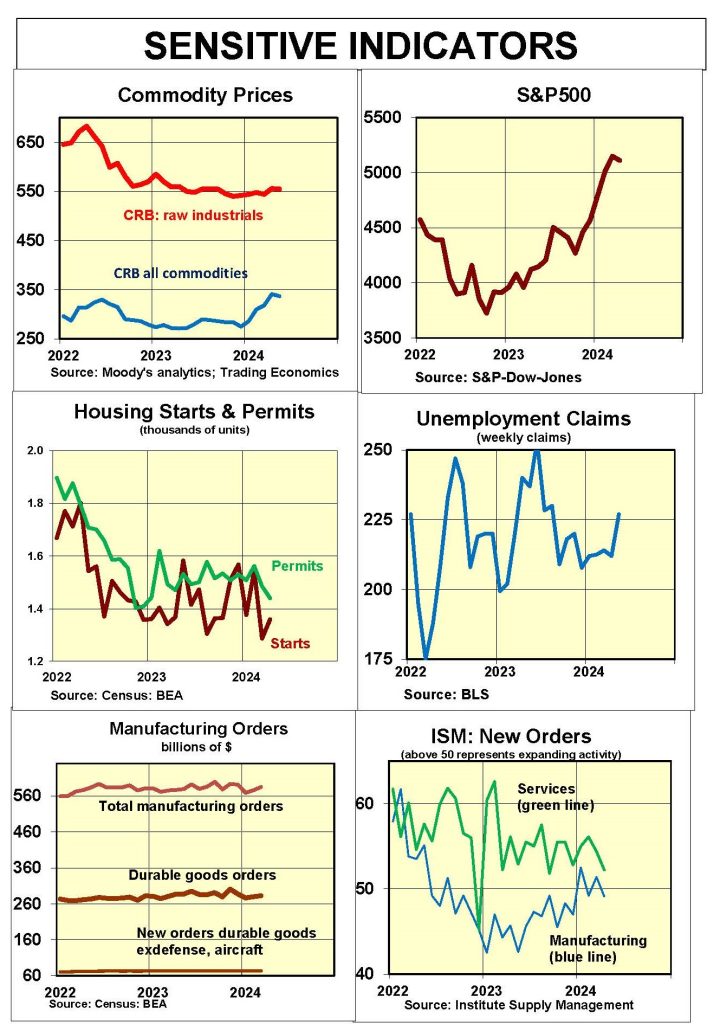
Sensitive indicators are mixed, showing no clear trend.
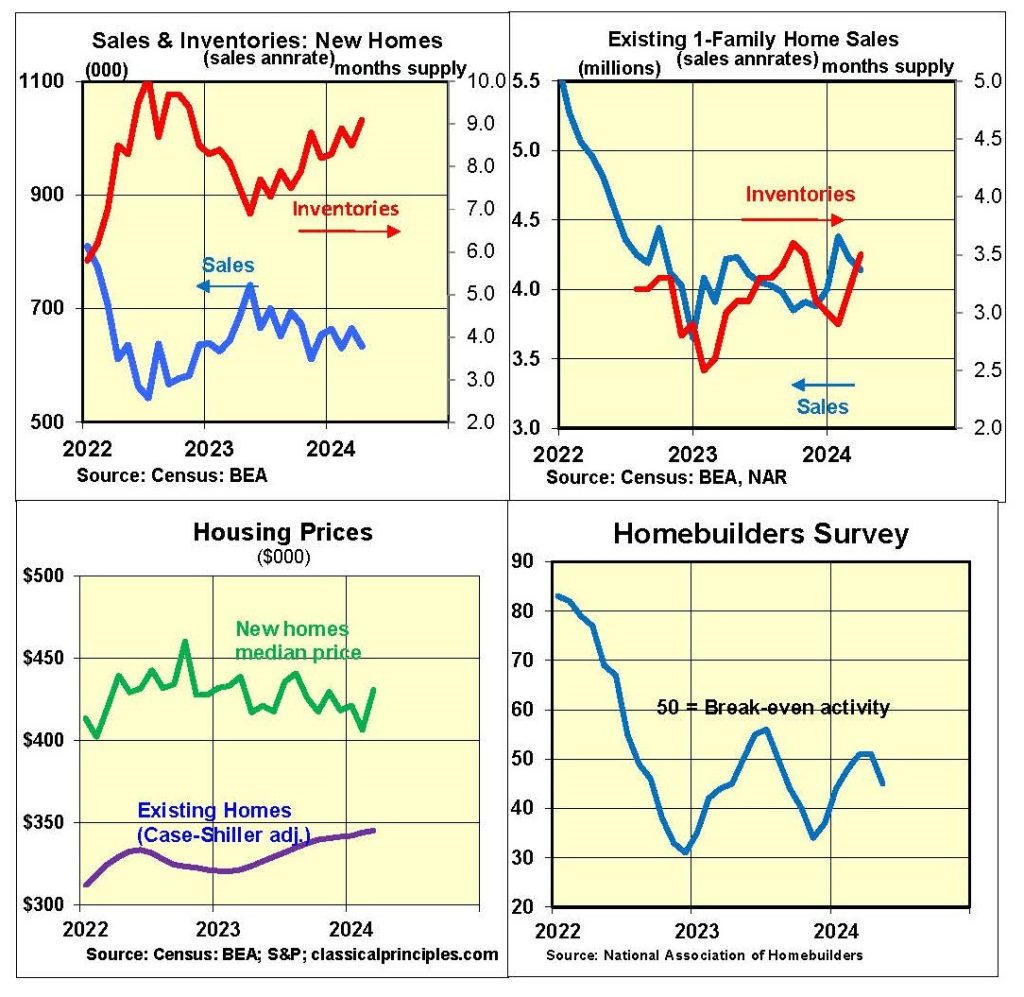
Housing activity shows signs of stabilizing, with the Homebuilders’ Index close to break-even. High inventories are keeping median prices for new homes somewhat depressed. Existing home prices moved higher due to a lack of inventories. Both housing starts and permits remain depressed.
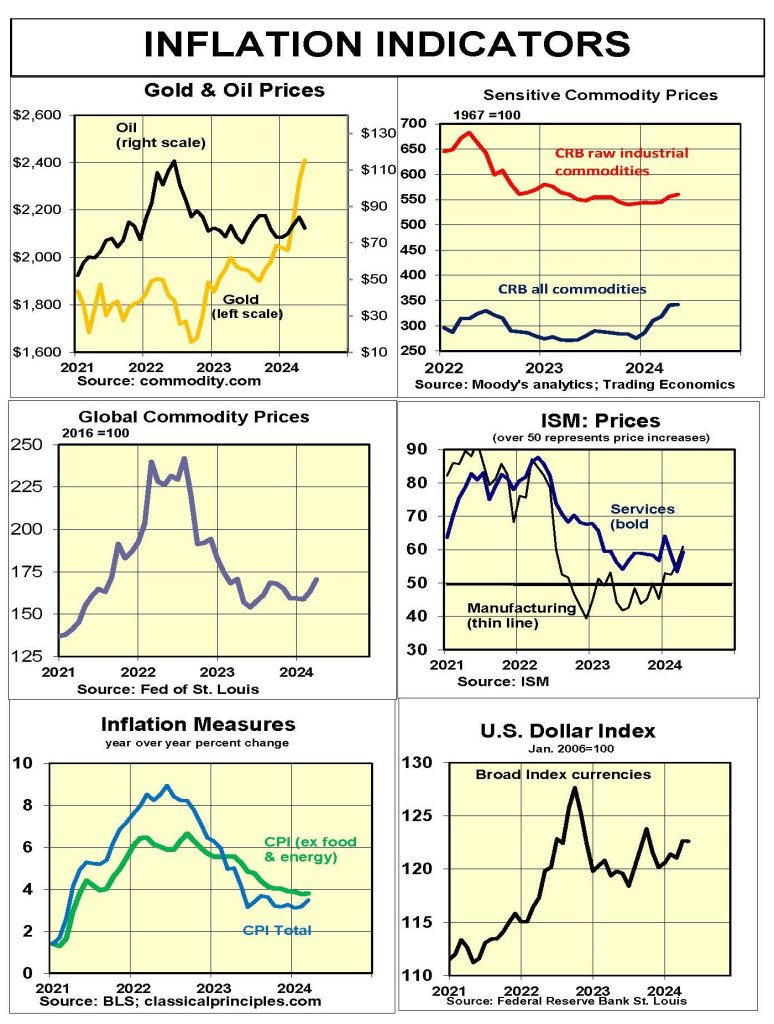
Commodity prices recently moved moderately higher. However, oil (one of the most important commodities) has fallen sharply.
The government series on new orders has been flat for over two years, with the most recent months showing a recovery from lower levels.
The ISM survey of new orders is positive for service companies, but negative for manufacturing.
The stock market continues to advance, pointing to investor confidence that the economy and corporate profits will remain strong.
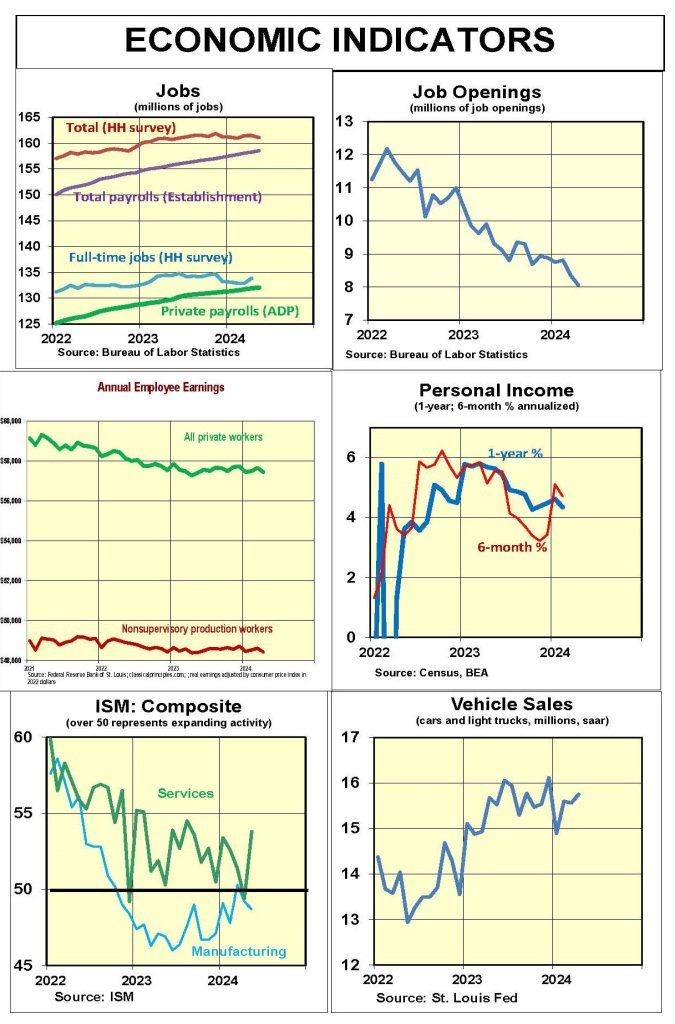
Most coincident indicators show the economy continued to expand into the spring. The ISM survey of service companies shows a sharp upward shift in May. With a few exceptions, job numbers continue to be mostly positive. While job openings continue to fall, May job openings were a million higher than at the end of 2019.
Inflation Indicators
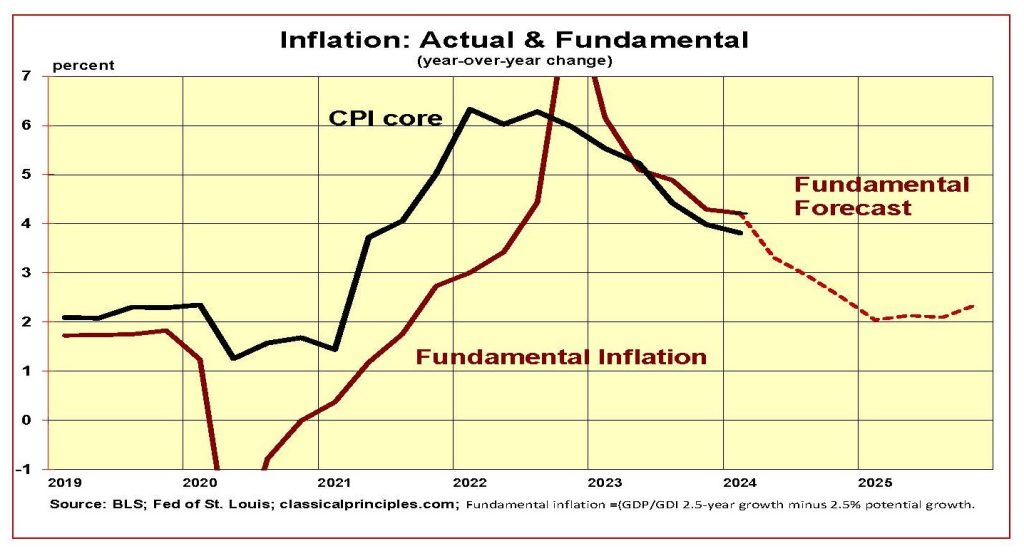
Our model continues to point to inflation moderation. Our model has only two inputs: (1) the 2½-year rate of spending based on an average of GDP and GDI, and (2) productivity. Our fundamental inflation estimate takes the growth in spending and subtracts real growth.
In the first quarter of 2024, the 2½-year spending rate was 6.7 percent. Our forecast shows this spending rate declining to 4 percent by the first quarter of 2025. We estimate the economy’s underlying fundamental real rate of growth rate is in the vicinity of 2 percent. Subtracting the real growth rate from spending gives us a fundamental inflation rate in the vicinity of 2 percent by early 2025.
The most recent inflation data point to an uptick in most commodity prices. In addition, the ISM surveys for May show businesses costs and prices continue to rise at rates above the Fed’s targets. If this continues, the Fed will not be able to reduce interest rates until the end of this year and into 2025.
Interest Rates
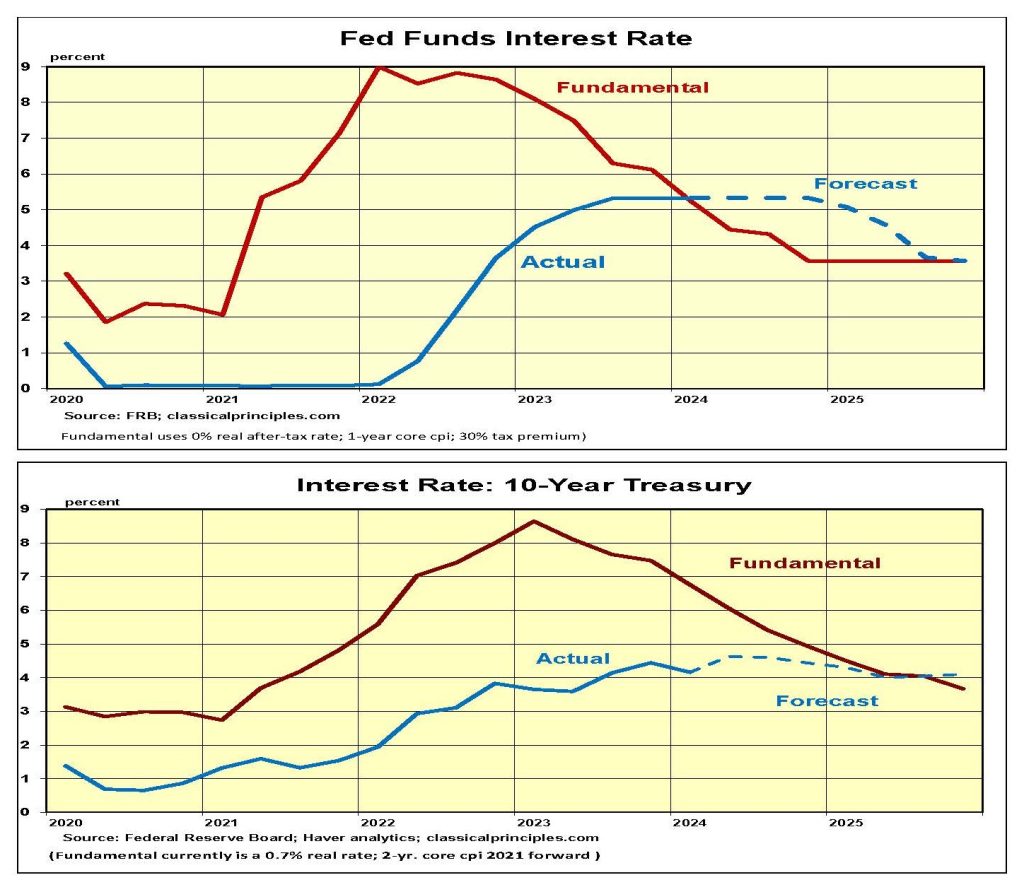
We expect current dollar spending to increase at a 4 percent annual rate in the latter half of this year. At this rate, the economy would avoid a downturn, but stubborn inflation will delay any cuts in short-term interest rates.
The chart below shows our forecast of the fundamental fed funds market rate moving below the Fed’s interest rate target. From the standpoint of interest rates, this represents a restrictive policy. This conflicts with signs of a tentative increase in money.
An analysis of the 10-year Treasury yield shows the fundamental rate moves toward 4 percent by early 2025. The speed at which longer-term rates decline depends on the market’s perception of the Fed’s commitment to reaching its inflation target. We expect the Fed’s inflation-fighting resolve will keep the 10-year Treasury heading gradually toward 4 percent for the year ahead.
Stock Prices: S&P 500
In early 2008, I warned that the Fed’s monetary restraint would create a recession and send stock prices sharply lower. In the spring of 2009 I used the increase in the money supply to advise clients to get back into stocks.
Using the money supply as a guide to the direction of stocks worked well for many years. In the past two years, it has been counterproductive, The growth in money in 2022 pointed to an increase in stocks during a downturn in the market. In 2023, the decline in money pointed to a decline in stocks at a time the market was soaring.
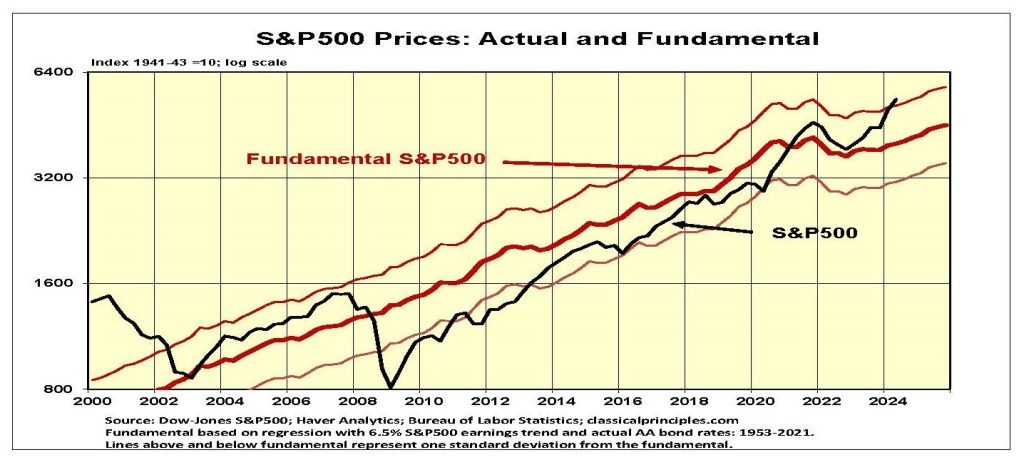
The failure of money to provide a helpful guide to the market is due to the Fed’s extreme of putting large amounts of money into the economy and then taking it out. Investors began anticipating the Fed’s next move. In 2022, as the Fed poured additional money into the economy, investors sold stocks, assuming the Fed would have to tighten policy. Beginning in 2023, investors began buying stocks, assuming the Fed would adopt a more expansive policy as soon as tight money produced a recession.
Although investors’ assumptions about when Fed policy would change have not been very accurate, the market behaved as if the assumptions were valid.
The current challenge is to provide a systematic way to assess where stock prices are heading without relying on either investors’ assumptions about the Fed or the money supply.
Technical Analysis
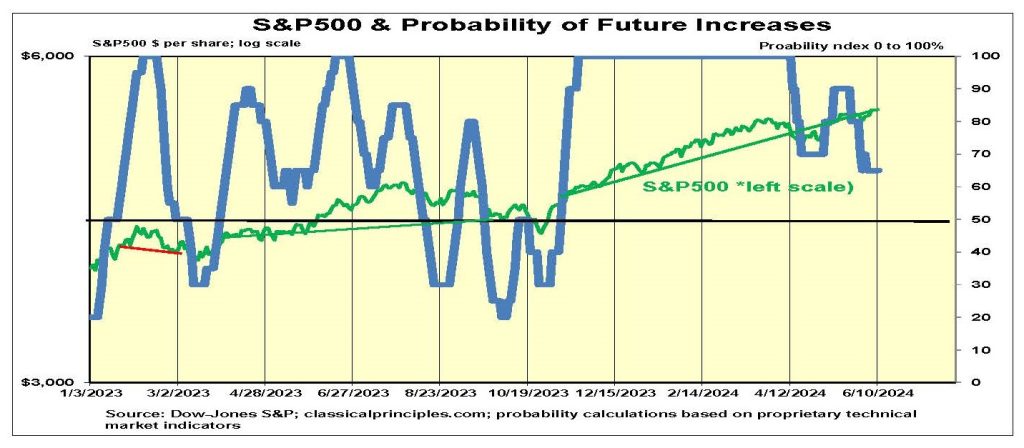
Technical analysis attempts to predict short-term moves in stock prices by examining various patterns in the data. There are many ways to do this. One way we have been experimenting with is to track the stock market’s momentum.
Our approach uses various support and resistance levels such as 10-day, 21-day, 50-day, and 200-day moving averages. We examined periods when these averages crossed, the speed at which the crosses occurred, and the extent to which current daily prices were a certain percentage above or below these key support and resistance areas.
We analyzed almost a quarter-century of S&P500 daily data. The analysis shows cyclical patterns that enable us to place probabilities on the extent to which stocks are likely to continue to rise.
While the probabilities can change abruptly, there were numerous periods where the odds of high or low probabilities occurred for extended periods. These examples strongly fovored holdiing or not holding stocks during extended bull and bear markets.
The probabilities during the first nine months of 2023 moved erratically during a period of relative stability in stocks. Beginning November 9, 2023, the probability moved from 40 percent to 90 percent within five days. It moved to 100 percent from November 21, 2023. The probability of further gains remained at 100 percent until April 15, 2024. As of June 11, the probability of further gains in the S&P500 has eased to 65 percent.
The recent probability patterns shown in the chart below are characteristic of history. As with all momentum tools, ours is far from perfect. However, it has and should continue to provide useful insight into the extent to which the market’s most recent momentum will continue.
More economic analysis from Robert Genetski.
For more great content from Budget & Tax News.
For more from The Heartland Institute.


")

