The Week That Was
Retail sales data in May remained sluggish. The largest retail sales number, including food services rose at a weak 1 percent annual rate, as was the past three- and six-month rates of increase. Over the past year, retail sales were up only 2 percent.
If these figures are accurate (they often are not), the economy is much weaker than the GDP estimates suggest.
A declining Homebuilders’ Index to 43 was another sign of economic weakness. Housing is a reliable leading indicator. At 43, the Index is seven points below breakeven and four points below the average of the past year. Housing joins retail sales in pointing to a slower, economy.
Initial unemployment claims in the first two weeks of June were 235,000, up from 213,000 in the year ending in May. This number is highly erratic (it reached 253,000 in June, 2023), so the recent increase may not be significant.
Things to Come
The main event next week (other than the presidential debate) will be Friday’s report on May consumer spending, income, and inflation. The Fed likes this inflation report because it tends to be lower than the CPI.
In the year ending in April, both the total and core measures of this inflation rate were 2.6 percent. The Cleveland Fed model anticipates good news from the May number. It calls for a 0.07 percent increase in total inflation and 0.1 percent for the core rate. If so, these low numbers will keep the yearly core inflation close to 2½ percent. This should reduce any upward pressure on long-term interest rates, at least until the June CPI report.
At this point, the Cleveland Fed estimates, the June CPI core inflation will be 0.28 percent. This would keep the year-over-year core inflation at 3½ percent. If so, it suggests the Fed will maintain its current interest rate target through the summer and into the fall.
Market Forces
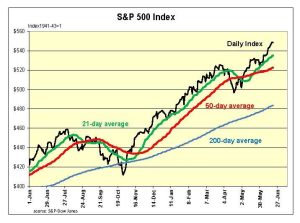
 The bulls keep running for the third consecutive week. So far, the normal pause or modest downturn correction has yet to occur. Yesterday, our short-term momentum model for the S&P500 hit its highest reading at 100. After today’s close, it moved to 80. By next week we will see if this is an aberration
Our model shows the S&P500 is overvalued by 35 percent. Instincts still tell us we are long overdue for a correction, or at least a pause in the bull market.
While a momentum model can change quickly, since November 2, 2023, there were only four days when our model was below 50 and only four days when it was at 50.
Most of this week’s reports point to a slowdown. Retail sales, the Homebuilders’ Index and initial weekly unemployment claims depict a weaker economy. In contrast, today’s Atlanta Fed model shows second quarter real growth at a strong 3 percent annual rate.
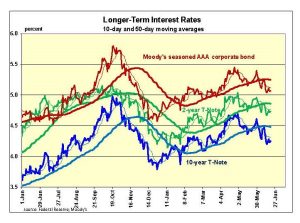
 The weaker economic numbers kept downward pressure on interest rates. With the 10-year averages substantial below 50-day averages, technical indicators point to the yield on 10-year T- Notes remaining below 4.5 percent. The Cleveland Fed’s estimate of the next core CPI report also indicates rates should remain close to their current range.
With the likelihood of relatively low interest rates and the potential for stocks to continue their upward momentum, the odds point to higher stock prices.
Outlook
Economic Fundamentals: positive
Stock Valuation: S&P 500 overvalued by 35 percent
Monetary Policy: restrictive
For more analyses by Robert Genetski.
For more great content from Budget & Tax News.
For more from The Heartland Institute.


