

Life, Liberty, Property #70: The (possibly beneficial) end of trust in institutions is upon us. (Commentary)
by S.T. Karnick
IN THIS ISSUE:
- The (Possibly Beneficial) End of Trust in Institutions
- Which to Believe: Polls or Pols?
- Economic Numbers Turning from Confusing to Ominous
- A Timely Reminder About ‘Our’ Democracy
- Cartoon
 The (Possibly Beneficial) End of Trust in Institutions
As a political and constitutional matter, President Joe Biden’s decision to step down from the Democratic Party presidential nomination is entirely up to him, if in fact he did make that decision himself, as we are obliged to assume in the absence of any direct evidence otherwise. Similarly, Biden’s decision to endorse Vice President Kamala Harris is fully within his rights, with the same proviso.
These decisions, however, make mincemeat of the claims by Biden and the Democrats that they are the valiant defenders of democracy in the United States and that former president and current Republican nominee Donald Trump is a unique and deadly threat to that same principle. (They have been using the word existential to convey the thought of Trump as murderous while maintaining deniability on their part. That is neither honorable nor justifiable, especially in light of the mighty odd coincidence of their years-long campaign having culminated in an assassination attempt, purely by chance, of course.)
The incoherence of claiming a passion for the defense of democracy while casting aside the votes of all the people across the country who took the trouble to renominate Biden through the primary elections is flagrant and indeed brazen. The people who run the Democrat Party made a political calculation that Biden would do them more damage by running than by dropping out, and it is obvious that they forced him out for venal political reasons. Respect for democracy certainly did not affect their considerations at all.
On top of all that, with Harris already trailing Trump in presidential preference polls, the political machinations behind the Democratic ticket may not be over yet.
Meanwhile, Republicans have spent the entire twenty-first century conservatively promising to fight the advance of the Left—seldom presenting a positive agenda of their own—and consistently backing down as soon as any real fight began, if not earlier.
This chasm between talk and actions by the nation’s political class has become increasingly obvious, and not because the corporate press has held them to account, especially as regards the Democrats, but also in the countless cases of GOP capitulation to the opposing party’s agenda in the face of the obvious wishes of the Republican Party’s voters.
The corporate media have long been doing the very opposite of its supposed role of holding politicians accountable, instead hiding the truth and propagating lies while leading a censorship regime coordinated with the activist Left of the nation’s political sector plus a vanguard class of international elites. The exposure of Biden’s incapacity during the June 27 debate destroyed any remaining illusion that the corporate press has been doing its job.
On the contrary, the exposure of both parties’ offenses against their voters has been accomplished largely by independent journalists self-publishing through small, scantily funded web outlets, through the X social media platform, and via newsletters such as this one. Consequently, just as the nation’s political parties have lost their credibility, so have the political press and the corporate media.
On balance, the destruction of trust in these institutions is a positive development. Yes, it makes it more difficult for the political and cultural classes to lead. However, it has likewise made it more difficult for the political and cultural classes to lead the people to their destruction. That may prove to be a major unexpected benefit of the rampant political mendacity of this era.
Of course, nothing will change for the better until the people who have been so regularly betrayed by these scoundrels remove them from power. How that might occur will be the topic of further discussion in future.
 Which to Believe: Polls or Pols?
Presidential polls before Joe Biden resigned from his party’s impending nomination suggested that Donald Trump was leading by five percentage points, hardly an insurmountable obstacle to a second Biden term. This rather small lead arrived after a disastrous debate performance by Biden on June 27, further indications of incapacity on Biden’s part in the weeks afterward, a drumbeat of politicians and press calling on Biden to resign his candidacy for the good of the party, and the assassination attempt against Donald Trump that resulted in indelible images showing strength and concern for his followers and the American people.
Five percentage points seemed a rather small lead after all that, even considering that a large portion of the population dislikes Trump.
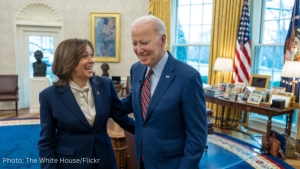
Then, shortly after Biden resigned and designated Vice President Kamala Harris as his preferred successor, a major poll stated that voters preferred Harris over Trump by two percentage points—and by four points when Robert Kennedy Jr. was included among the choices. That was quite a turnaround—seven percentage points. The poll inspired glee among Democrats and other never-Trumpers.
The poll, of course, was fake, as numerous critics quickly noted. From ZeroHedge:
A new Reuters/Ipsos poll has found that Harris leads Trump 44% to 42% in the national poll (with a 3% margin of error).
Yet, there’s a catch. As we noted in the 2016 and 2020 elections, pollsters had their thumb on the scale by oversampling Democrats.
Well, they’ve done it again—sampling 426 Democrat voters vs. 376 Republicans and 341 Independents.
ZeroHedge was right to suspect that the Reuters/Ipsos poll was not accurate. It was an outlier from the start, the website noted:
Meanwhile, other polls have Trump smoking Harris.
By last Thursday, the Reuters/Ipsos had been thoroughly discredited, with Rasmussen finding Trump leading Harris by 50 percent to 43 percent among likely voters. In fact, “Never once in any of our polls has Kamala Harris ever outperformed Joe Biden. It just doesn’t happen,” Rasmussen Reports lead pollster Mark Mitchell told War Room. “America does not like her more than Joe Biden.”
As Mitchell told the War Room audience, it’s easy for pollsters to make mistakes. Oversample one group and your result could be way off.
That is one reason why it is wise never to believe publicly released opinion polls, even though there are often some that are close to the truth. It is hard to know which one is right at any particular time.
The biggest reason, however, not to put too much stake in the polls cited in the corporate media is the presence of a much more reliable indicator: what the politicians do. The corporate media are largely charlatans, after all, and they gravitate toward covering whatever they think will benefit their preferred candidates. The poll results they convey are not to be trusted. Politicians, by contrast, have a powerful incentive to get the most accurate polling information possible: it is their guide to how effective their campaign efforts are. They will act on those numbers.
Having reliable numbers on public opinion is thus much more important to politicians than it is to news organizations, and politicians will pay a premium to get accurate numbers. The press, by contrast, risks little if they are a few percentage points off the mark, especially when all of them are wrong anyway.
Read the politicians’ actions if you really want to know which way the winds are blowing. The Democrats dumped their presidential candidate the weekend after the Republican convention and Trump’s nationally televised speech, less than a month before the Democrats’ convention and a couple of weeks before a preconvention online nomination “virtual roll call” was supposed to be held. That’s what their polls were telling them to do, I am sure. What their polls are telling them now is … an interesting question.
Sources: ZeroHedge; Rasmussen Reports
 Economic Numbers Turning from Confusing to Ominous
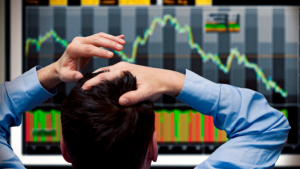
While the stock markets headed down last week, the federal government reported second-quarter economic growth was much higher than expected, at a 2.8 percent annual rate, up from 1.4 percent annualized in the first quarter. Stocks rose after the report, though the Nasdaq and S&P 500 remained negative for the week.
The Wall Street Journal’s chart of the week’s trading showed a “rough week,” as the accompanying story put it:
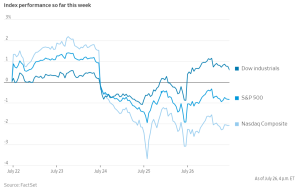
The plunge of the Nasdaq was particularly steep and disturbing, as that index had been doing exceptionally well.
In addition, economist and former Reagan administration budget director David Stockman notes, “$71 billion or 44% of the allegedly awesome $260 billion increase in Q2 real GDP consisted of a large inventory stocking gain. Real GDP excluding the inventory swing rose by only $89 billion or a pretty limpid 1.6% at an annualized rate.” Inventory stock is a volatile component that does not correspond well to overall economic trends and in fact often portends economic contraction when it rises.
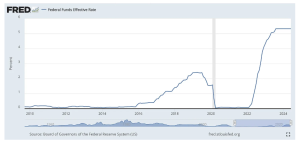
The week’s events continued the pattern of inconsistent and contradictory indicators from the economy. This is based in great part on the widespread understanding that the Federal Reserve (Fed) has long been awaiting bad economic news before it will reduce interest rates and stimulate the economy. The Fed does not want to lower rates too early, lest it set off a new round of price inflation. Thus, the Fed refuses to reduce interest rates unless the economy shows higher unemployment, lower gross domestic product (GDP), stock market losses, and the like.
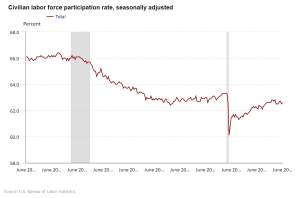
High interest rates are supposed to cause stock prices to fall. That has not been the case with the current round of rate increases, because inflation drives up asset prices. High interest rates are also supposed to increase unemployment, but they have not done so appreciably, thus far. That is because overall labor force participation is still well below the pre-pandemic norm, thus reducing the number of people seeking jobs:
Many economists have been predicting a recession for many months now in the wake of the rapid interest rate increases of March 2022 through July 2023, which the Fed has held steady ever since. To me, either there will be a recession or major economic principles have somehow been falsified in the past couple of years.
The bizarre government actions perpetrated during the Covid pandemic certainly distorted the economy greatly and created such strange conditions that restoration of normal cause-and-effect relationships has been exceedingly difficult. The supply disruptions, gigantic infusions of federal spending and helicopter money, enormous increase in consumer dollars spent on services, and other pandemic-related economic mischief grossly warped the price signals that enable markets to create the best possible allocation of goods and services across the economy. It is taking an unexpectedly long time for more-normal conditions to develop.
Such forced inefficiency must have negative effects on the nation’s production of goods and services. I believe that that is exactly what happened and is why the economic data have not made sense over the past couple of years.
Meanwhile, the Fed continues to assume the numbers do make sense and what we really need are a couple of months of higher unemployment and lower GDP or a stock market crash, and they can then cheerfully start lowering interest rates (albeit too slowly) and save the day … after everything has fallen into chaos.
Substack author Quoth the Raven (QtR) argues that the Fed is playing a dangerous game, as I, too, have been saying for the past year and a half:
The cold hard fact is that two years of higher rates after 15 years of taking on debt at near-zero rates is eventually going to grind the gears of the economy to a halt. It’s as simple as math. Rates go up, cost of debt goes up, discretionary spending slows as a result of higher debt service, businesses generate less cash, layoffs happens and round and round we go, spiraling into a de-leveraging cycle.
In other words, this will have consequences. Try to act surprised when it happens, OK?
It’s only a question of how long it’s going to take to get there. My readers also know that I have been predicting this outcome for 18 months, while the stock market has done nothing but rocket higher. I underestimated how much liquidity there was in the economy and have been wrong on timing—though I don’t believe I’m wrong on outcome—for the past year or two.
QtR is pointing to the fact that economic fundamentals matter. Although it can be very difficult to filter out other highly important factors (liquidity in this case), policy actions will ultimately have their effects. In fact, sometimes those effects will turn out to be even greater, especially the damaging ones, when they finally manifest, because the fundamentals worsened while the problems were obscured by the positive indicators.
That may in fact be happening now, QtR writes: “macro data—which operates on a pretty significant lag—is starting to turn into ‘ugly’ territory, indicating that a true economic slowdown could already be taking place, just not showing up in the data yet.”
QtR cites an article by economist Peter St. Onge, of the Brownstone Institute and Heritage Foundation, that asks whether we are already in a recession. Figuring out what is really happening in the economy is a “herculean task,” St. Onge writes, because “every official economic number out there is broken.” That’s obviously important in itself, of course, but it is a massive problem now because “if the official numbers are wrong, it could mean we’re already in recession, masked by rising asset prices courtesy of the Fed.”
A major source of confusion, St. Onge writes, is that the way is inflation is calculated is highly complicated, has been changed over the years, and, I would add, might just be designed at least in part to diminish the proven inflationary effects of excessive government spending. If inflation is higher than the official numbers indicate, growth is less than we think, St. Onge notes:
To give a flavor, the official inflation rate since Covid has been around 21%. But fast food menu prices—a go-to indicator for foreign exchange investors—are up between 35% and 50%. People posting grocery receipts online say it’s actually more than 50%.
The problem is if inflation was actually, say, 35% it means GDP hasn’t gone up at all since pre-Covid. It means it actually went down. Implying we’ve been in recession for nearly 5 years.
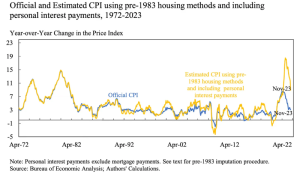
This is because official growth numbers are discounted by inflation. If growth was 3% but inflation was 2%, we grew. If inflation was actually 4%, we shrank.
That means that if inflation was actually worse than 35%—if, say, it was the 50% that grocery receipts say—that would put us near Depression levels with a 13% drop in real GDP since pre-Covid.
That would go a long way toward explaining two things: why the public believes inflation is worse than the numbers indicate, and why the people believe the economy is weaker than economists and Biden apologists say it is. This chart from portfolio manager Michael W. Green shows how the recent run-up in inflation has required much more of the average household’s income be spent on necessities:
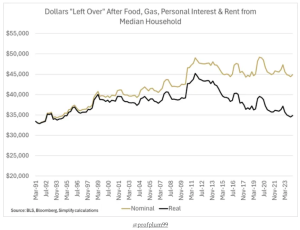
Source: Yes, I Give a Fig; h/t Daily Chartbook
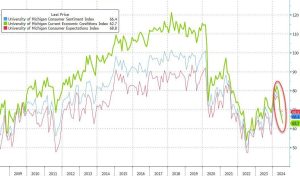
Consumer confidence is thus understandably far below where it was before the pandemic, as another chart from St. Onge illustrates:
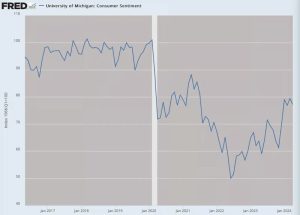
Consumer confidence has been falling rapidly in 2024 and is now at its weakest since December 2022, as this chart from ZeroHedge shows:
St. Onge cites multiple “data points and anecdotes” indicating economic weakness—observations of the sort that have regularly appeared in this newsletter and have intensified in the past few months. Among these indicators are “Americans seeing McDonald’s as a luxury item, buying groceries on credit cards, selling off second cars, and downsizing to smaller homes—all hallmarks of a recession,” St. Onge writes.
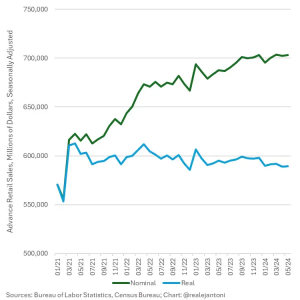
St. Onge provides a chart showing the divergence of reported nominal-dollar retail sales, which suggest growth, from the real, inflation-adjusted numbers, which show a contraction since President Joe Biden took office and began rapidly increasing government spending in an already-growing economy:
Meanwhile, manufacturing has decreased since mid-2022 even as the raw numbers suggest otherwise, as another chart from St. Onge indicates:
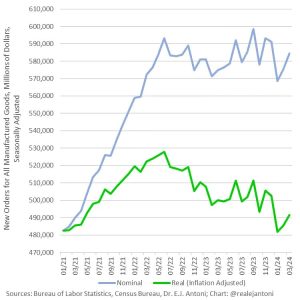
“My colleague EJ Antoni found that manufacturing orders have been flat for at least 3 years, while consumer spending has actually been negative for those 3 years,” St. Onge notes.
St. Onge argues that GDP is another dodgy number, as I’ve explained here before, because people take GDP to mean what the economy is producing (“product”), whereas it includes a major and increasing factor in consumption—government spending:
Even that grandaddy of statistics, GDP, may be an illusion. Because GDP counts government spending as production.
Which, of course, it is not: it’s spending, not building. So our current $2 trillion deficit is, on paper, automagically boosting GDP by nearly 7%. But the spending isn’t making us richer—it’s making us poorer as physical resources get squandered.
St. Onge calls this phenomenon of inflation hiding economic contraction an “inflationary depression.” The (government-spending-induced) monetary inflation creates an initial euphoria, especially among investors, at the increasing value of their properties, which is soon followed by painful price inflation and then a recession or depression, St. Onge writes: “[H]istorically, inflationary depressions are hard to see for the simple reason that asset prices pump before consumer prices do. The affluent keep spending since their stocks soared and their house prices soared—sound familiar?”
QtR also cites gold bug Peter Schiff’s recent observation that the United States is “about to face the aftermath of a Fed-induced housing crisis.” Writing at the Mises Institute and cited by Schiff, Montana State University finance and economics student Jonathan Yen notes high interest rates have driven the home sales index to its lowest point this century—even lower than during the late-2000s housing crisis and the 2020 lockdowns. “U.S. pending home sales have dropped to historic lows not seen since the 2008 financial crisis, with a shocking 2.1% drop in May and a jaw-dropping 6.6% annual decline,” Yen writes. This is creating dangerous ripple effects, Yen notes: “With mortgage rates so high, banks and other investors are in massive trouble, facing severe cash shortages.”
The Fed’s rapid interest rate increases to fight Bidenflation have had a much more damaging effect on mortgage rates than even what happened during the run-up to the housing crisis, Yen writes:
The position of new home buyers in 2024 is unprecedented. Not only are prices at record highs, but the new generation of prospective home buyers can’t remember a time without cheap mortgages. During the steep decline in pending sales between 2005 and 2007, the average 30-year fixed rate mortgage only increased by about one percent. Since January of 2021, the average 30-year fixed rate has increased by 4.21 percent.
“New home sales crashed 11.3% MoM [month-over-month in May] (after April’s 4.7% drop was revised up to a 2.0% MoM rise). That is the biggest MoM drop since Sept 2022,” ZeroHedge reported last month. “At the same time, the supply of available homes increased to 481,000, still the highest since 2008.” In June, “new home sales just confirmed the slowdown, dropping 0.6% MoM (notably below the 3.4% MoM expected) and also saw a major downward revision in May from -11.3% MoM to -14.9% MoM,” ZeroHedge reported last week. “That leaves new home sales down 7.4% YoY.”
“It is the slowest pace of home sales in any June since 1999, when the NAR began tracking the data,” Morningstar reports.
Higher mortgage interest rates have driven an increasingly large wedge between desirability and affordability. The Wall Street Journal reports:
Home prices hit a new high in June for the second straight month, the latest sign that the housing market is unaffordable to millions of Americans.
The spring home-buying season, usually the busiest time of year for the housing market, was a dud this year. Home sales declined in June for the fourth straight time on a monthly basis. The combination of high prices and elevated mortgage rates has made homeownership less attractive to renters and deterred current homeowners from moving.
But low inventory of homes for sale in much of the country is pushing prices higher. The national median existing-home price in June rose to $426,900, a record in data going back to 1999 and a 4.1% increase from a year earlier, the National Association of Realtors said Tuesday. Prices aren’t adjusted for inflation.
Although mortgage rates fell slightly in July, they are still much higher than what people are used to and remain an obstacle to buyers.
In response, Fortune magazine notes, builders are making the houses smaller, lowering their building costs so that they can increase the price per square foot, which economists call efficiency but normal people call “less house for a higher price”:
Home prices keep going up, yet new homes keep shrinking—and architects say they’ll just keep getting smaller, according to a July report by John Burns Research & Consulting (JBREC). Last year, about a quarter of new homes were downsized to cut costs, JBREC says, yet new-construction home prices increased by 2.5% in 2023, peaking at nearly $441,000 in August, U.S. Census Bureau data shows.
Housing prices are at a record high, indicating a shortage of supply, and sales have collapsed, yet the difficulty of selling has not driven prices down. That means, in short, that only people higher up on the income and wealth scales can afford a home. The Wall Street Journal story affirms that conclusion:
While the number of homes on the market has risen in recent months, it is still well below historical norms, which can lead to bidding wars for desirable properties. More than one-third of home sales in June went for more than their list price, according to real-estate brokerage Redfin. Sales of luxury homes rose in June compared with a year earlier, while sales of cheaper homes declined, which also pushed up the median price, NAR said.
Similarly, Morningstar notes that house purchases are now tilted toward the high end of the market and wealthier buyers:
Nearly 30% of properties were sold above list price, the NAR said, with homes receiving an average of 2.9 offers.
Sales of million-dollar-plus homes saw an uptick in June, the only increase among all price categories. Nationwide, sales of homes priced over $1 million rose 3.6% in June as compared with a year ago.
The combination of high prices and low sales has a well-known name when applied to the overall economy: stagflation.
Of course, although housing is a major component of people’s wellbeing, it is only one sector of the economy and does not prove that overall price inflation is still a problem. It is having an outsized effect on people of low to middle incomes, however, which helps explain why the public rates the economy less positively than analysts believe the numbers justify. The same is true of rising health care costs, the price of food, and the costs of other basics of life.
I think that the troubles in the housing market are emblematic of the current problems in the U.S. economy: low output suppressed by high energy costs and price inflation of business inputs, tighter credit which puts a further drag on output, increased borrowing by government and consumers alike at a much higher cost, and high government spending, which directs economic activity away from things people really want (indicated by the fact that they will pay for them voluntarily) to things that other people want them to want (indicated by the fact that they have to be forced to pay for them through taxes or debt, the latter being merely delayed taxes).
The real problem is excessive federal spending and regulation. The solution is to stop doing those things. Of course, that won’t happen before January 20, if then.
The economic indicators show that the U.S. economy is contracting and suggest that conditions might get much worse, all because of egregiously misguided government fiscal and regulatory policies and central bank monetary accommodation, St. Onge writes:
My base case has been that we’re repeating the 1970s disaster driven by out-of-control government spending and out-of-control Fed money printing. The official numbers are matching that almost to a tee.
But if, in fact, the real numbers are much worse—perhaps even as bad as voters and consumer surveys report—then we could be headed towards a proper Depression.
In fact, said St. Onge, in a YouTube video last week, “stagflation is already on our doorstep.” I believe that St. Onge is right. Stagflation will burst through the door and ransack America unless voters decide to change course this fall.
Sources: The Wall Street Journal; Contra Corner; Quoth the Raven Substack; Money Metals Exchange; Mises Wire; The Wall Street Journal; Fortune; Morningstar; The Wall Street Journal; City Journal
 A Timely Reminder About ‘Our’ Democracy
Here is the number of times the word democracy or one of its derivations is mentioned in the Declaration of Independence and the Constitution of the United States and its amendments: 0.
Sources: Declaration of Independence; Constitution of the United States
Cartoon
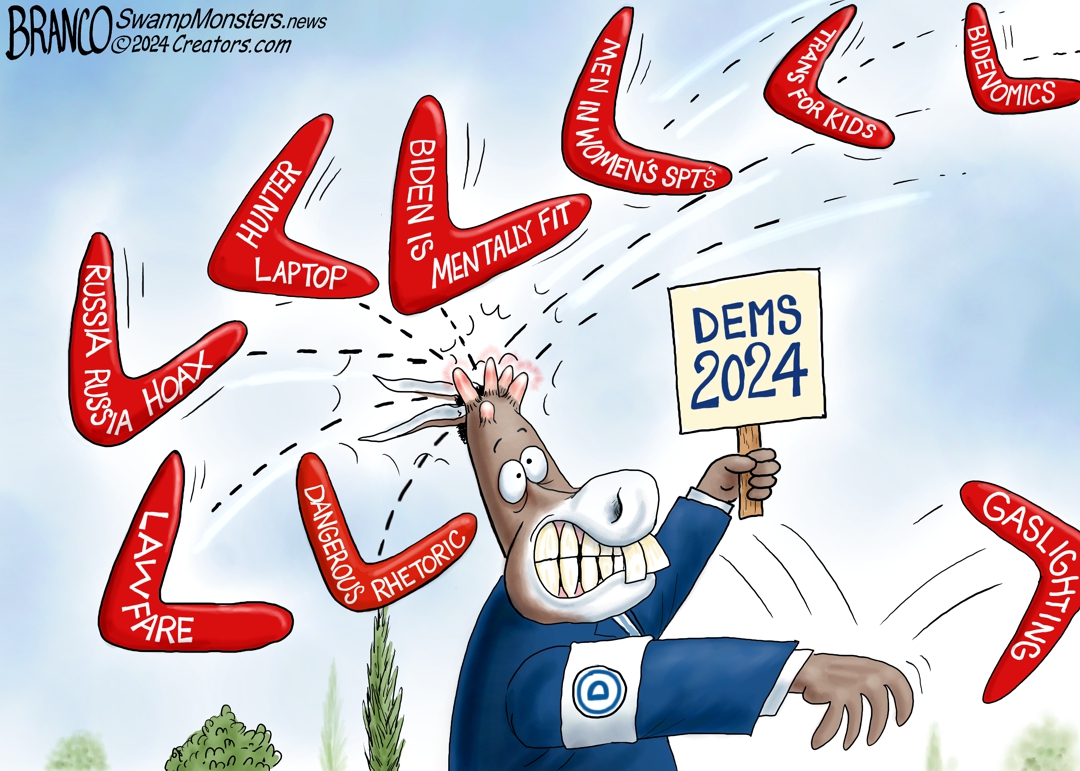
via Comically Incorrect (A.F. Branco)
For more Rights, Justice, and Culture News.
For more Budget & Tax News.
For more from The Heartland Institute.


")


 end of trust in institutions is upon us. (Commentary))