


By Robert Genetski
Based on a potential change in which political party holds the White House, the prospects for a major positive shift in U.S. economic policies are improving.
Policy shifts have consequences. In 2020, the outbreak of Covid produced a major move away from free-market classical economic principles. This continued when the Biden administration increased the government’s control over the economy.
In Loper v. Department of Commerce, the Supreme Court provided a landmark decision placing limits on the expansion of federal regulations.
The Court held that “the Administrative Procedure Act requires courts to exercise their independent judgment in deciding whether an agency has acted within its statutory authority, and courts may not defer to an agency interpretation of the law simply because a statute is ambiguous; Chevron is overruled.”
In the 1984 Chevron case the Supreme Court held that “A government agency must conform to any clear legislative statements when interpreting and applying a law, but courts will give the agency deference in ambiguous situations as long as its interpretation is reasonable.”
The Chevron ruling provided the rationale for a vast expansion of the regulatory state since lower Courts relied on regulators to interpret the law. In Loper, the Supreme Court vacated Chevron, ordering lower courts to resolve ambiguous statutes. It also put the burden on Congress to state their intent clearly.
The main impact of Loper will be to shift power from regulators into the hands of judges and Congress. This will limit the power and expansion of federal regulations.
Limiting regulations is important because the current effect of regulations amounts to $3.7 trillion a year, or 13 percent of GDP. With federal spending at 24 percent of GDP, and state and local spending at 14 percent, government has direct control over more than half the income Americans earn.
Limiting excess regulations provides the potential to release enormous fiscal and physical resources.
The November elections present another potential force that would seal the move back to pro-growth classical principles. As a businessman, Trump is well aware of the burden regulations and federal spending place on businesses.
Although uncertainties over election outcomes will continue, the prospect of a second Trump presidency plus Republican control of Congress would create a major shift toward pro-growth policies.
A minor shift in a positive direction occurred in 2016 when Republicans controlled Congress and began limiting federal spending. Trump followed with major tax cuts and restraints on regulation. A Trump 2 administration already has geared up to hit the ground running.
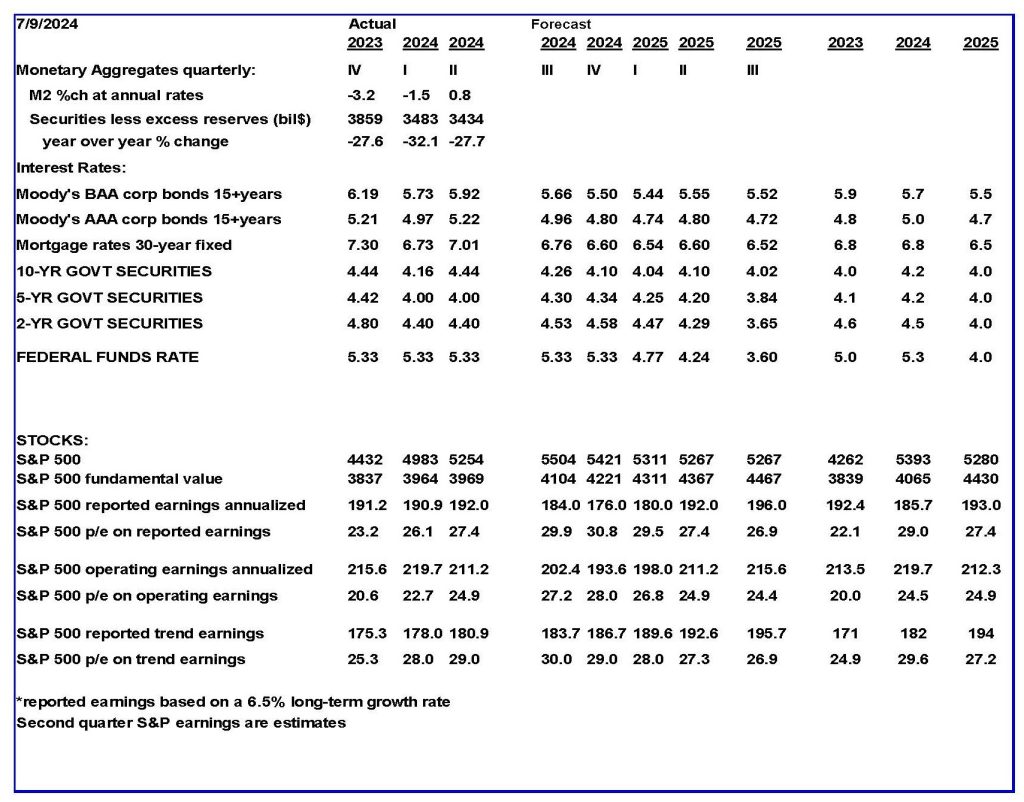
Monetary Indicators
The Fed’s erratic monetary policy has put the economy through the ringer.
The chart below shows key measures of the money supply. Changes are mostly driven by changes in the smallest measure of money—the Fed’s holdings of securities less bank reserves. Adding currency produces high-powered money (HP$) which represents the monetary liabilities of the government. Adding bank deposits to HP$ produces M2, the most common measure of money.
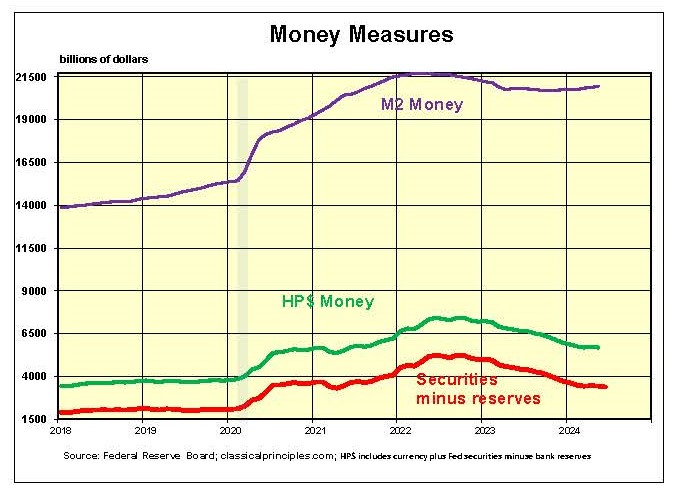
The most recent expansion and contraction in the main source of money began in 2021. It is the reason for the highly disruptive record-high inflation, rising interest rates, and the current signs of economic weakness.
These disruptive events could have been avoided had the Fed paid attention to the money supply. Instead, the Fed purchased more than $1½ trillion in securities. Pressure to purchase these securities came from some economists who claimed that large increases in both federal spending and money would not cause inflation. They were wrong.
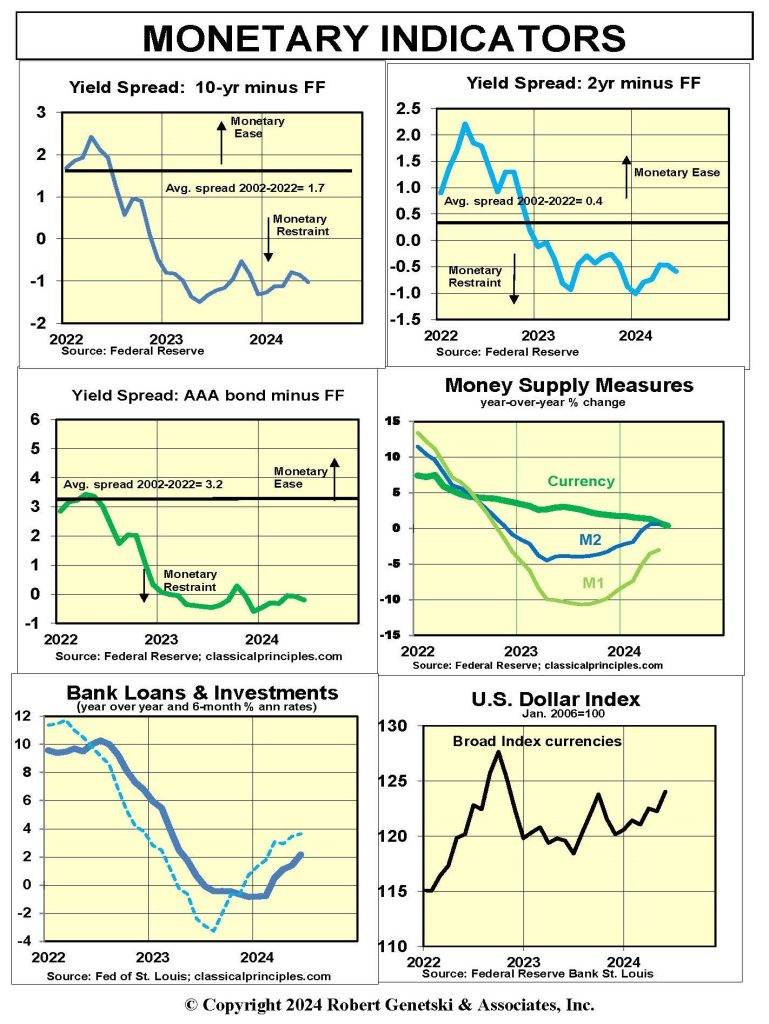
Our monetary indicator charts show the main source of money is leveling off. However, bank deposits recently have increased along with loans and investments at commercial banks.
We believe policy remains restrictive despite signs of a slight increase in some money measures. Short-term interest rates remain above longer-term rates, inverting normal yield curves. These are signs of financial stress and confirm tight money is the order of the day.
With the most potent money measures flat to down in June, look for a further slowing in business activity through to the end of 2024. The timing of a shift to an easier policy, along with a recovery, will depend on further progress in limiting inflation.
Continued high oil prices, a soaring stock market, and relatively low unemployment are likely to make the Fed extremely cautious before cutting rates.
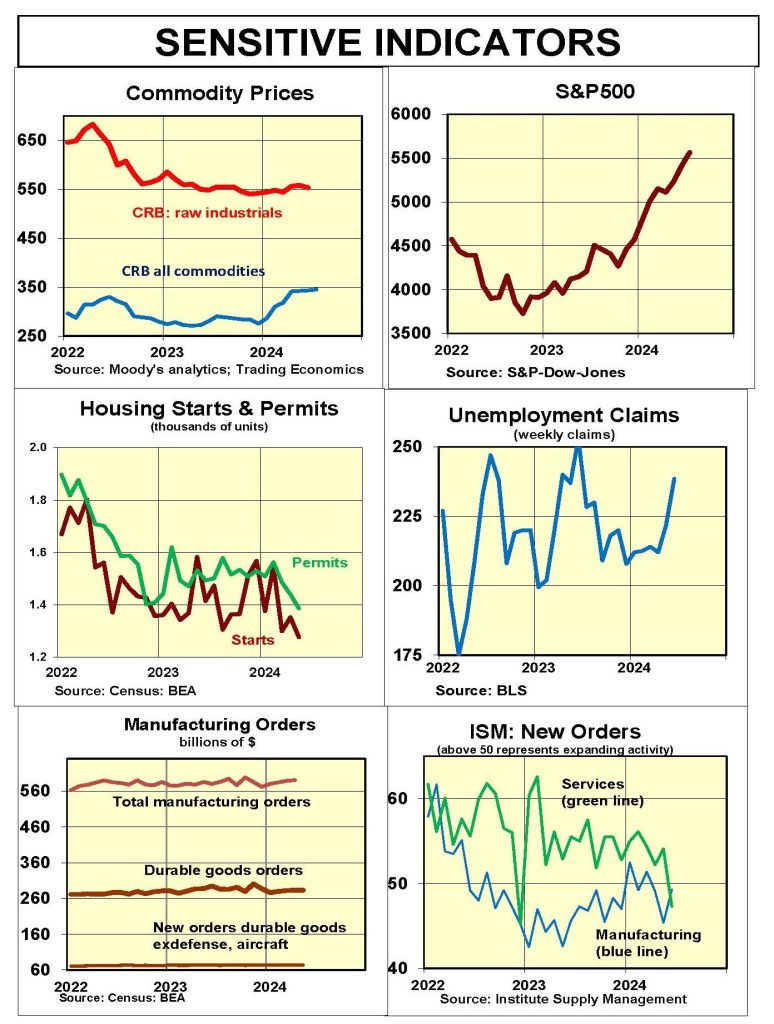
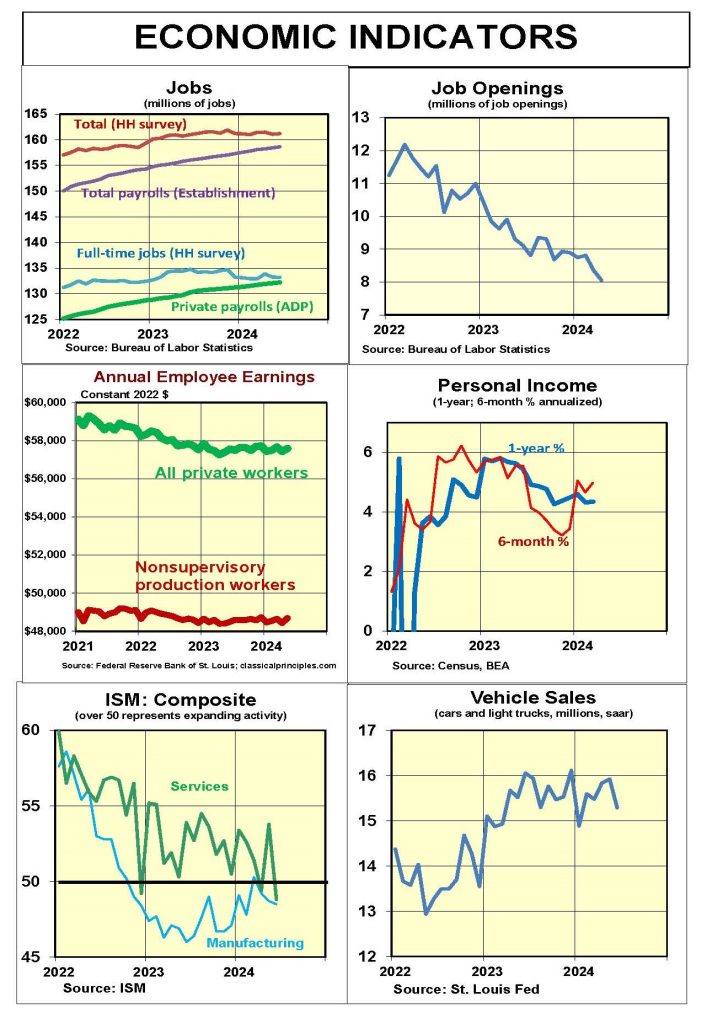
Sensitive Indicators
Sensitive indicators remain mixed. In financial markets, stock prices point to a strong economy while inverted yield curves point to a downturn.
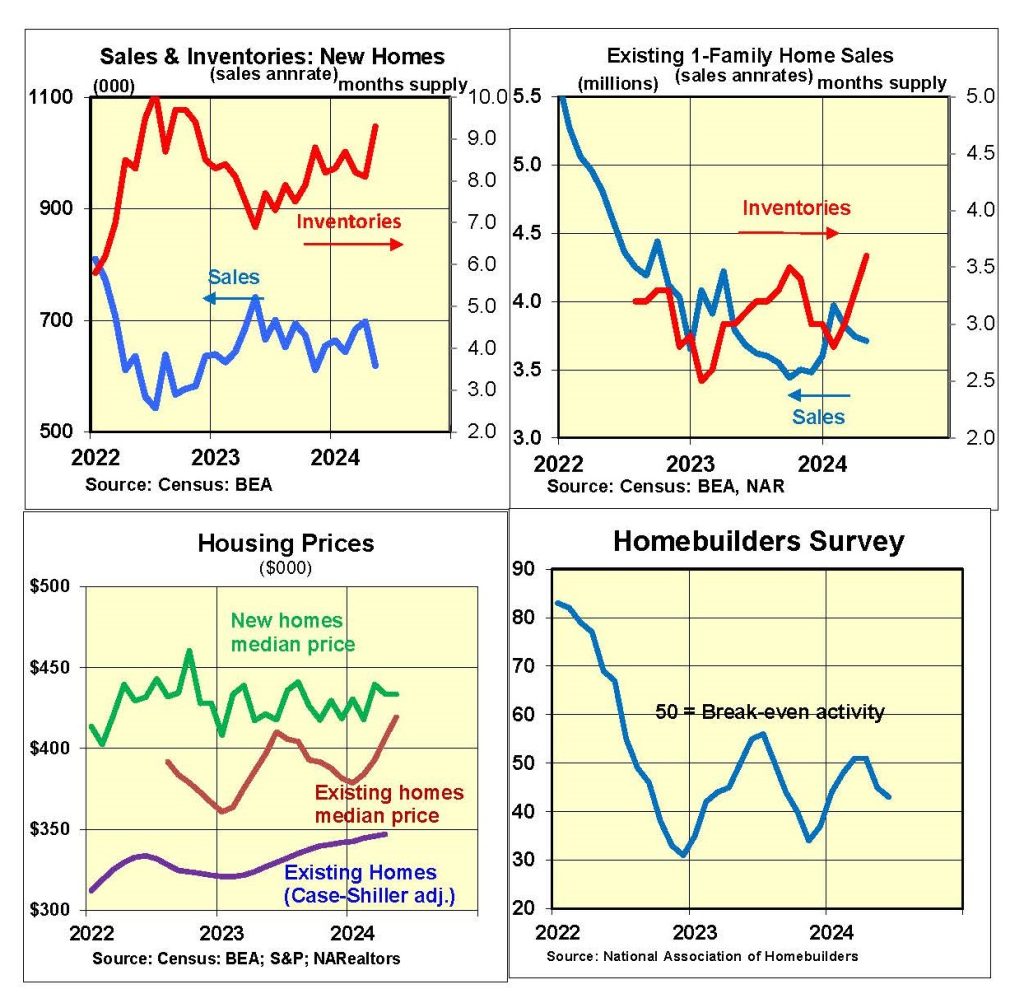
Housing activity remains mostly depressed. Sales of new and existing homes remain down. The Homebuilders’ Index is negative, and starts and permits are depressed. Even so, home prices remain elevated, creating serious obstacles to homebuyers.
In an abrupt turnaround, the June ISM composite and new orders business surveys have turned negative. If this continues it would provide early confirmation of a downturn. However, in contrast to the ISM surveys, an alternate S&P June business survey found the economy moving ahead rapidly.
While economic indicators remain mixed, there has been a shift toward more weakness than in prior months.
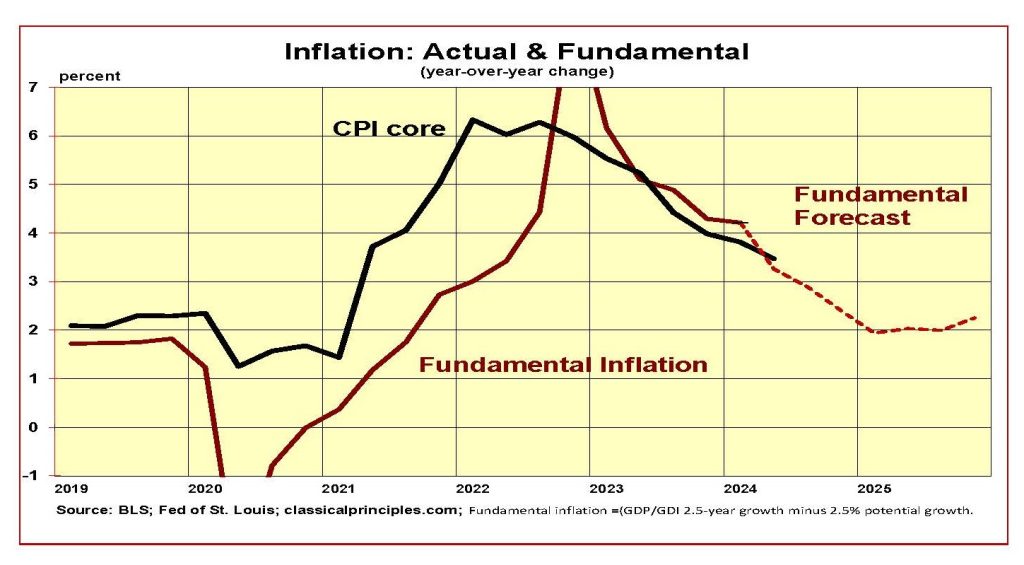
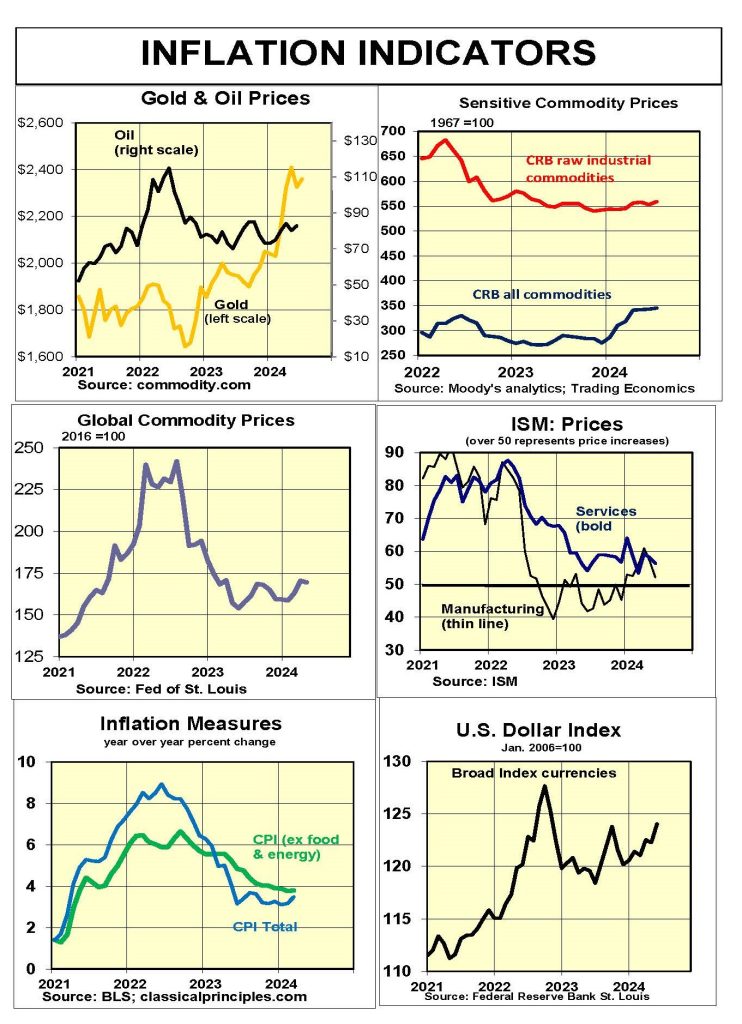
Inflation Indicators
Inflation continues to unwind. Using the May core CPI for the second quarter average produces a year-over-year core inflation of 3.5 percent. Our fundamental inflation model estimates the year-over-year rate at 3.3 percent.
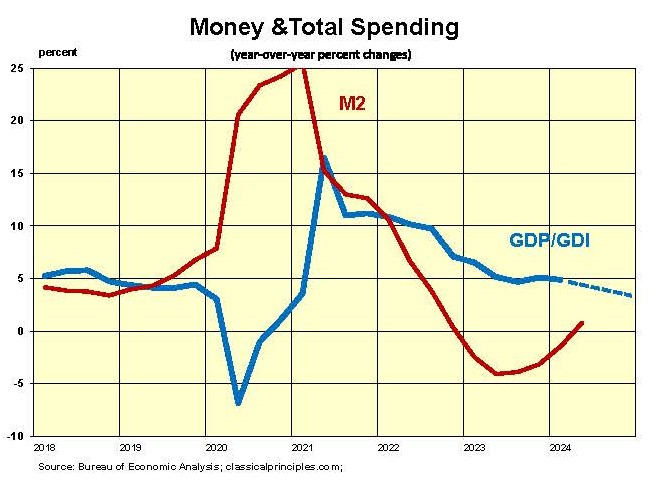
The model produces this estimate by taking the annualized GDP spending over the past 2½ years (5.8 percent) and subtracting an estimate of the economy’s potential output (2.5 percent).
Our forecast over the next three quarters slows the 2½ year spending rate to 4½ percent. Subtracting 2½ percent for real growth produces an estimate of 2.0 percent for fundamental inflation.
Our estimate is based on the slowdown in spending between now and the first quarter of 2025. Inflation also depends on our estimate of potential growth of 2.5 percent.
If the economy is stronger than we anticipate, or if the economy’s potential growth rate is only 2.0 percent instead of 2.5 percent, inflation will be higher than our estimate. Some of my associates believe inflation will be higher.
Interest Rates
We expect current dollar spending to increase at a 3 percent to 4 percent annual rate over the next three quarters. At this rate, the economy could avoid a downturn, whereas stubborn inflation wouldl delay cuts in short-term rates.
The chart below shows our forecast of the fundamental fed funds rate. At the end of 2023, it moved below the Fed’s interest rate target. When the fundamental is below the Fed’s target, it signals tight money.
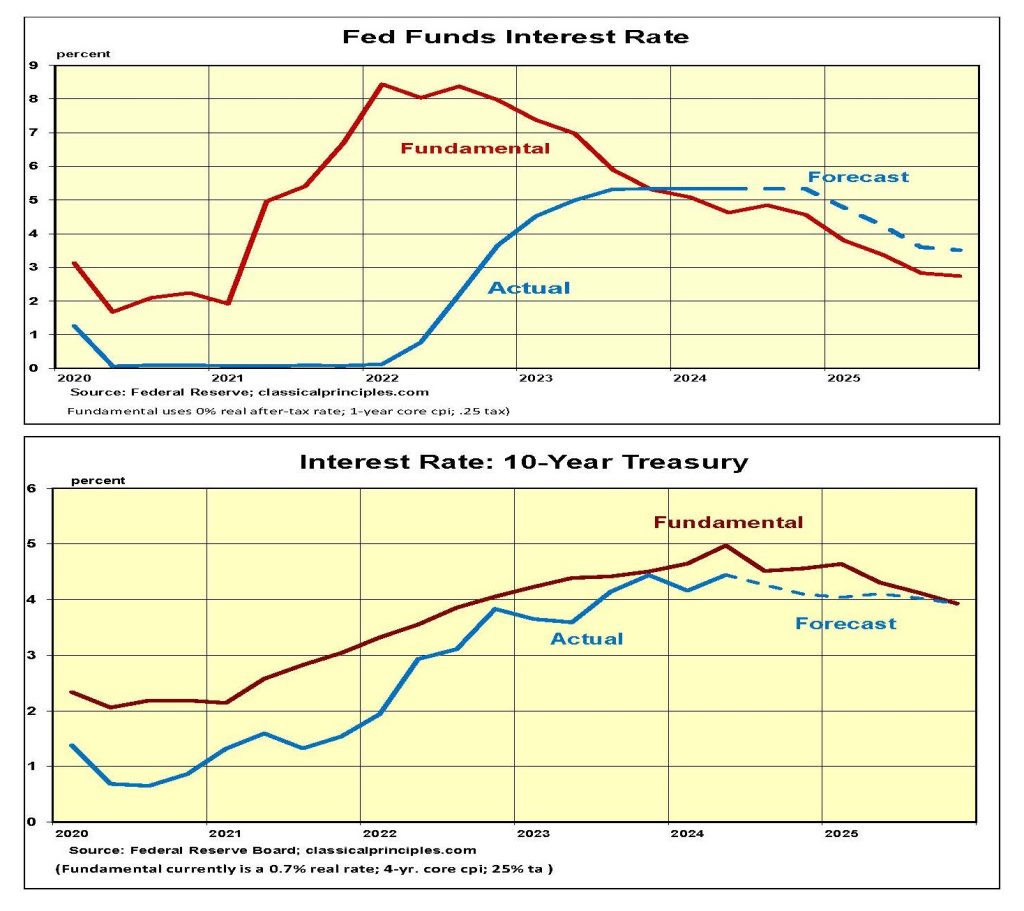
Our analysis of the 10-year Treasury yield shows its fundamental rate moving gradually toward 4 percent by early 2025. The speed at which longer-term rates decline depends on the market’s perception of the Fed’s commitment to reaching its inflation target. We expect the Fed’s inflation-fighting resolve will keep the 10-year Treasury heading gradually toward 4 percent for the year ahead.
Stock Prices: S&P500
The bull market in stocks raised the S&P500 to 37 percent above our estimate of its fundamental value. As the chart below indicates, stock prices are currently more overvalued than at any time since 2000, when the S&P500 was more than 100 percent overvalued.
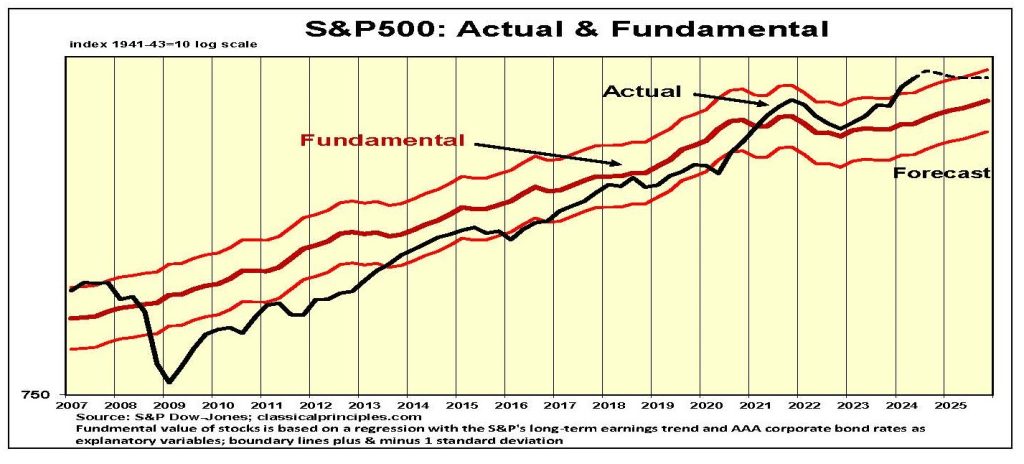
After 14 years of mostly rising stock prices, many investors believe the risks associated with holding stocks are fairly low. The opposite situation existed for 12 years after the financial crisis of 2008. In early 2009, stocks were selling for half their fundamental value. For the next 12 years, investors overestimated the risks of holding stocks. It wasn’t until 2021 that the market became overvalued.
While our fundamental stock model is urging caution, our short-term momentum model remains positive. The chart below shows the daily S&P500 index (green) along with the model’s near-term outlook for stocks. The index or probability of furher gains is on the right axis and extends from 0 (sell everything!) to 100 (most favorable).
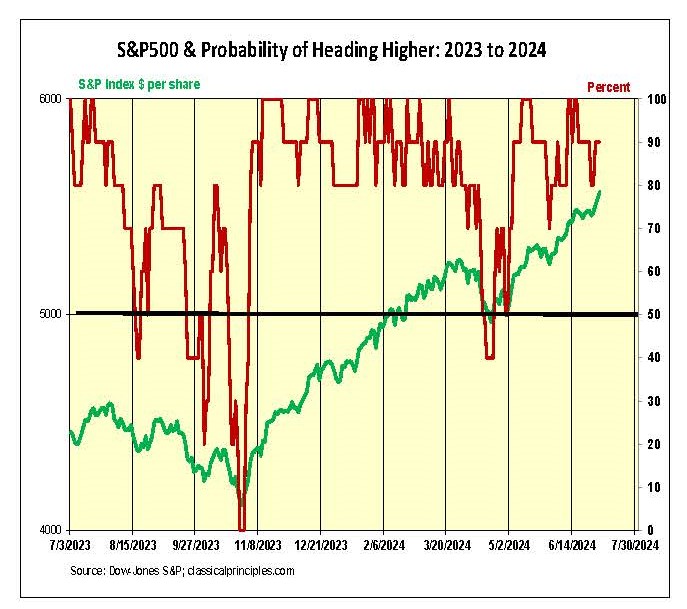
The key to this model is its ability to identify key shifts in momentum. Over the past year, the index flashed erratically from July to October. It turned dramatically higher (90 percent) on November 6, 2023. With one brief exception, it has been very positive ever since.
I look at the daily and five-day average as a guide to momentum. Sensitivity to the model will depend on each investor’s risk tolerance.
More economic analysis from Robert Genetski.
For more great content from Budget & Tax News.
For more from The Heartland Institute.


")

