Robert Genetski: Fed policy of reducing the monetary base is ending, amid signs of slower growth in the economy. (Analysis)
The Week That Was
June retail sales data failed to increase for either the past month or the past 3- and 6-month periods. Sales are up only 2 percent for the past year. However, retail sales data are erratic and subject to large revisions. Nonetheless, the recent numbers point to a clear decline after inflation.
Most housing indicators also indicate a serious downtrend; the July Homebuilders survey slipped to 42 (50 is breakeven). With mortgage rates and new home inventories remaining high, the housing market remains depressed.
Things to Come
Next week there will be a lot of housing market data released. None are as important and current as the early July Homebuilders’ Index—which says it all—housing activity is depressed.
Wednesday the S&P advance business survey for early July will give the first hint of early July activity. In contrast to signs the economy is slowing, the S&P’s June survey showed the service sector increasing faster than any time this year. If the July survey continues to show strength, the odds are that strength in the service sector is overpowering the apparent weakness in retail sales and housing.
Thursday’s second quarter GDP report is expected to show current dollar spending increased at close to a 5 percent annual rate. The breakdown would be roughly half from real growth and half from inflation.
Friday’s consumer spending and income and inflation report for June will show inflation continues to moderate. According to the Cleveland Fed’s model, June inflation will be essentially the same at the June CPI—0 percent for both the total and core measures.
The spending and income report also will show the extent to which the economy is slowing. It is a more reliable and comprehensive survey of the economy. This should confirm or deny the weakness in retail sales and housing, or if the potential strength from the S&P June survey is real.
Market Forces
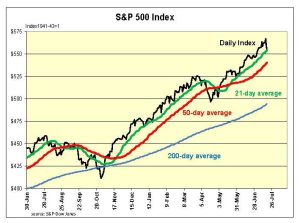
After an extended period of steady gains, stocks sputtered this week with mixed results. The Nasdaq and QQQs declined 2½ percent to 3 percent while the S&P500 was down 1 percent. In contrast, the Dow and small cap ETFs rose 3 percent to 4 percent.
 Investors have not been abandoning stocks. Rather, they are rotating out of high-flying techs and into more conservative companies which had been underperforming. The sharp decline in the S&P500 to 5545 puts it at the 21-day moving average, often a key support area of support.
Our short-term S&P500 momentum model has a strong still positive reading of 80 percent. This is down from 90 percent to 100 percent earlier in the week. If the S&P500 were to break below its current area of support, it would tend to further reduce the odds of a strong upward moving in stocks.
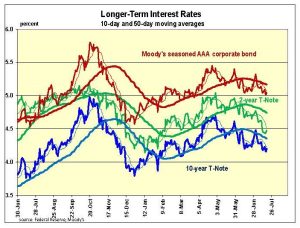
Most of this week’s economic news still points to a slowing economy. As expected, this put further downward pressure on interest rates, with the 10-year T-Note yield slipping slightly to recent lows.
 The tentative signs of a business slowdown led the futures markets to place a strong 94 percent likelihood the Fed will lower its target interest rate by a quarter percentage point at its September meeting.
While most financial observers focus on the Fed’s target rate, we continue watching the amount of money the Fed is adding or removing from the economy. Through the first half of July the monetary base (high-powered money) is no longer declining. It has been unchanged since March. With money no longer coming out of the economy, monetary policy has turned less restrictive.
The relative easing in money should reduce some of the pain from tight money. Unless there is a sharp reversal in corporate earnings, the odds continue to point for further upward momentum in stock prices.
Outlook
Economic Fundamentals: positive
Stock Valuation: S&P 500 overvalued by 35 percent
Monetary Policy: restrictive
For more analyses by Robert Genetski.
For more great content from Budget & Tax News.
For more from The Heartland Institute.


