

Americans have a less than three percent chance of contracting COVID-19, according to an analysis by Professor Anne Marie Knott of Washington University in St. Louis.
Knott, a professor of business with a strong background in mathematics, presented her findings in an online town hall to faculty and Staff at the Olin Business School on May 13, 2020, entitled, “Why You Haven’t Caught Covid.”
Anti-COVID-19 policies in the U.S. (and the U.K.) began in earnest on March 15, 2020, when the Imperial College of London promoted a model forecasting that 265 million Americans would contract the virus and that 2.2 million people would die from it if no preventative measures were taken, according to Knott.
It was primarily on the basis of these projections that government at the federal, state, and local levels intervened to stem the spread of the virus, including the recommendation of social distancing, the imposition of widespread lockdowns of the economy, and the reordering of treatment priorities in hospitals to favor COVID-19 patients.
It is now known these projections were off by a factor of 20, Knott says. The number of COVID-19 deaths is likely to be approximately 120,000, not 2.2 million. Knott dismisses the notion that government intervention is responsible for the lower infection/death rate, pointing out that, in contrast, deaths from the flu are up this year. To understand how an error of this magnitude could be made, Knott says, it is important look to the non-cases—the people who did not get sick.
Measuring How Disease Spreads
Knott and others note that an infectious disease’s potential to spread is dependent on what is called the R (reproduction) number, with “1” being the threshold between an infectious disease’s rise and fall.
By contrast, the Imperial College of London forecast was based on an R “naught,” or R0, model, which measures the basic reproduction rate of a disease based on a worse case scenario. It projects the number of people one person will infect assuming everyone is susceptible to the virus. “R,” however, measures the effective reproduction number and is crucial to understanding the trajectory of an epidemic. It takes into consideration the proportion of people who are immune to a pathogen, for example, or how a population reacts by protecting itself.
“An R of 1.5 would see 100 people infect 150, who would in turn infect 225, who would infect 338. In three rounds of infection, the number of people with the virus will have quadrupled to 438,” the World Economic Forum (WEF) points out, in an analysis by Peter Beech.
“Conversely, an R of less than 1 means the virus will eventually peter out—the lower the R, the more quickly this will happen,” states Beech. “An R of 0.5 means that 100 people would infect only 50 people who would infect 25, who would infect 13. As the number of cases drop and the ill people either die or recover, the virus will be brought under control—as long as the R remains low.”
An R of 1 or higher indicates explosive growth while an R of 1 or lower suggests the end of an outbreak, states Beech.
The R0 for this year’s seasonal flu is 1.3, and the projected R0 for COVID-19 was 2.4.
Seaborne Petri Dishes
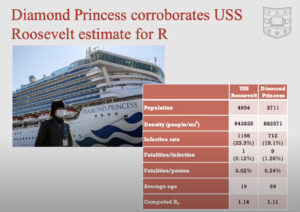
Knott says there are two instances or “petri dishes” where outbreaks occurred which can now tell how COVID-19 spreads: the U.S.S. Roosevelt, a naval aircraft carrier, and the Diamond Princess, a cruise ship. In both cases, shipmates and cruise passengers were in tight, confined spaces and the outbreak could “fully propagate,” meaning no one had a chance to disembark once the disease was identified.
On the Roosevelt, in particular, sailors slept in berths stacked three-bunks-high, with no space for “social distancing.” The population density on the carrier is 943,835 per square mile, yet nearly 77 percent were resistant to COVID. Population density on the Diamond Princess was 883,571 per square mile and 81 percent of passengers avoided infection. Average population density in the U.S. is 92.9 residents per square mile, according to Statista.
Knott determined the R0 for the Roosevelt to be 1.14 and 1.11 for the Princess. Average age on the Roosevelt was 19 with one fatality and 69 on the Diamond Princess with 9 people who succumbed to the virus.
(Graphic: Courtesy AnneMarie Knott)
Looking forward and trying to find an explanation of what happened is the essence of her approach, says Knott. “An alternative to my approach when you don’t have a completed outbreak, is to divide the daily data, use the first set of days to estimate R0, then use the second set to test how well you forecast what happens next,” said Knott. “Researchers did this for the Diamond Princess and we knew by February 26, they were off by over 100%. That should have raised alarms.”
“Spending $3 Trillion and shutting down society to save lives from COVID-19 seemed unfair to the 2.8 million people who die each year from other causes,” Knott said. “We are now spending 50 times more per COVID death than per heart death, and 80 times more per COVID death than influenza death. This seems backwards, since heart disease and flu are with us for the foreseeable future, whereas COVID looks like it may disappear after this year.”
Knott says it is important for policy makers to look at data with a critical eye. “I think the big lesson for policy makers is to get a second (at least) opinion before committing the largest increase in federal spending since World War II,” said Knott. “Michael Levitt at Stanford was posting daily analysis of Covid data beginning February 2, with different conclusions than Imperial College. Why did their forecast prevail?”
Bonner R. Cohen, Ph.D., (bcohen@nationalcenter.org) is a senior fellow at the National Center for Public Policy Research and a senior policy analyst with the Committee for a Constructive Tomorrow (CFACT).


")


[…] reference is to early outbreaks of COVID-19 aboard the USS Theodore Roosevelt and the cruise ship, the Diamond Princess, in which a number of […]