


2022 saw rapid increases in spending, high inflation, little real growth, declining living standards and public discontent. What’s ahead?
Year that Was
2022 is the third year of the dramatic shift in government policies away from free-market classical economic principles. 2022 has been a year of rapid increases in current dollar spending, high inflation, little real growth, declining living standards and public discontent.
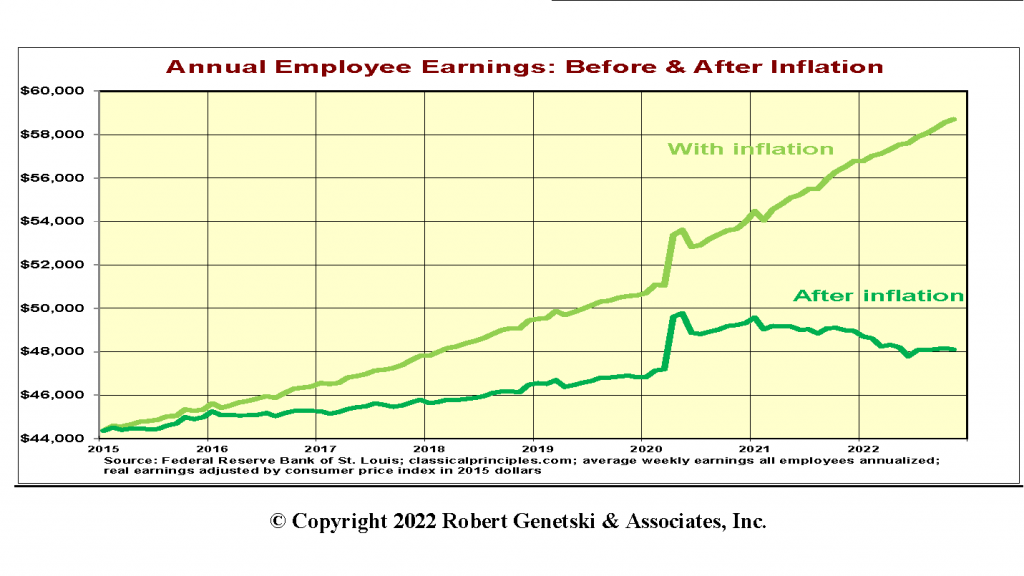
In 2016 to 2019 government policies moved toward classical principles. As a result, real earnings grew steadily from 2017 until the government-force lockdown in early 2000. Average real earnings soared in 2020 as many lower wage earners were locked out of work. Average earnings then declined as these workers returned. An ongoing shortage of workers has kept earnings above where they were before the lockdown.
For 2023, a restrictive monetary policy is forecast to significantly slow current dollar spending (GDP). See details on measuring Fed policy and its impact on spending in the section on Monetary Policy.
The impact of monetary restraint already has hit the stock market and housing. In 2023, the signs of economic weakness will spread through much of the rest of the economy.
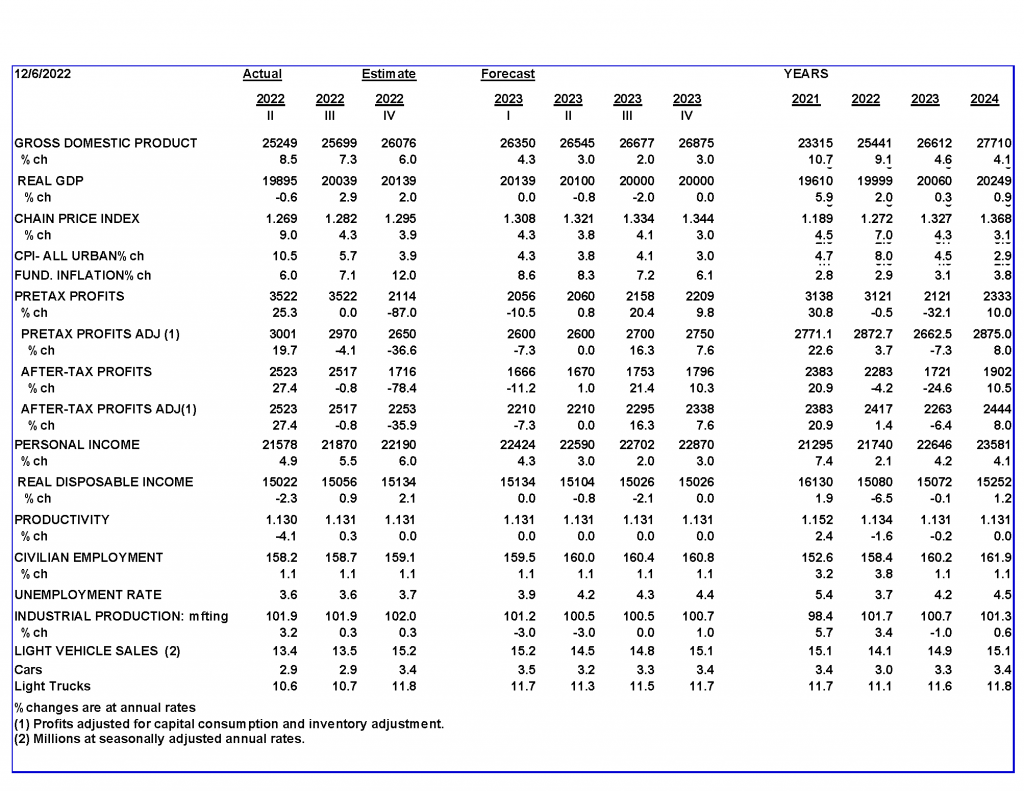
Increases in federal spending and regulations have taken their toll on productivity, which fell by 1.3 percent in the year ending in the third quarter. With little hope for any meaningful control over federal spending and regulations, an improvement in productivity is unlikely.
Without an improvement in productivity, it will take a significant easing in demand to contain inflation. As a result, the outlook for 2023 is for continued monetary restraint and higher interest rates through much of the year along with a moderate and extended downturn in real output.
Monetary Indicators and the Economy
Since the creation of the Federal Reserve in 1913, its monetary decisions have impacted the economy. Whenever the Fed creates more money than business needs to produce output inflation occurs. When the Fed creates less money than business needs, the results are slow growth or a downturn.
Since the financial crisis of 2008 the Fed has used its unprecedented power to add or remove massive amounts of money into or out of the economy. Such power has led to an unprecedented increase in the Fed’s portfolio.
There are numerous ways to measure monetary ease or restraint. One measure has been to observe Fed purchases of securities, which usually is the way the Fed increases the money supply.
In addition, our analysis considers the behavior of trillions of excess bank reserves—balances banks hold at the Fed. When banks reduce these deposits, they increase the amount of money in the economy.
Measuring the change in money from the Fed’s purchases or sales of securities, minus banks excess reserves, provides a measure of the change in money entering the economy. The following charts show Fed purchases or sales of securities, excess bank reserves, and the combined effect of both labeled liquidity.
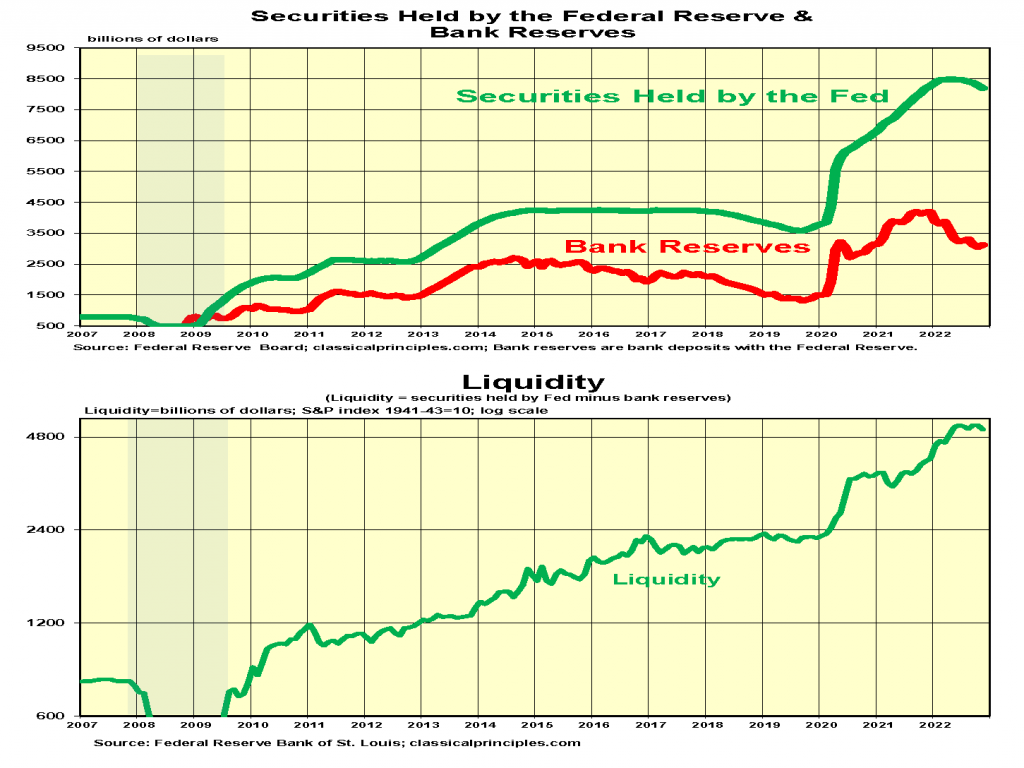
These monetary measures reveal the massive increase in money from early 2000 until the spring of 2022. This increase produced the double-digit surge in spending and the highest inflation in 40 years.
The measures also show how the Fed stopped buying securities in the spring of 2022, about the same time they began raising interest rates. Finally, the chart shows how banks have reduced their deposits at the Fed, thereby offsetting some of the Fed’s intended restraint.
Our conclusion is that the Fed’s monetary restraint began in July 2022 when the combination of Fed sales and bank reserves first began to decline. Even with this five-month decline, the year-over-year increase in liquidity still was 26 percent. This leads to the conclusion that money remains expansive.
While it may be reasonable to conclude that money remains expansive, we have argued that money is dynamic and that much of the economy over the past two years has already digested the explosive increase in money. If so, the recent leveling off or modest decline in money is a major change that represents restraint.
We also contend that monetary policy does not occur in a vacuum. Other financial indicators should confirm a period of monetary restraint.
This is happening as yield curves become inverted—where short-term interest rates move above longer-term rates. Inverted curves often precede recessions. The yield curve charts on following page show actual data through November and estimates based on rates in early December.
Other charts on the following page show more traditional measures of the money supply, which also point to a restrictive monetary policy.
Hence, despite the liquidity measure showing a substantial amount of bank reserves in the economy, numerous other signs point to monetary restraint. These signs support the case for a slowing in spending.
In terms of timing, a normal 6-to-9-month lag would produce a significant weakening in current dollar spending in the first half of 2023. While the extent of the slowdown in spending is highly speculative, the extent of the decline in housing activity and the stock market is not. Both point to a downturn in output of at least 2 percent to 3 percent.
The magnitude of the decline and prospects for recovery depend on how long the Fed maintains its restraint and how quickly inflation subsides.
![]()
Sensitive Indicators
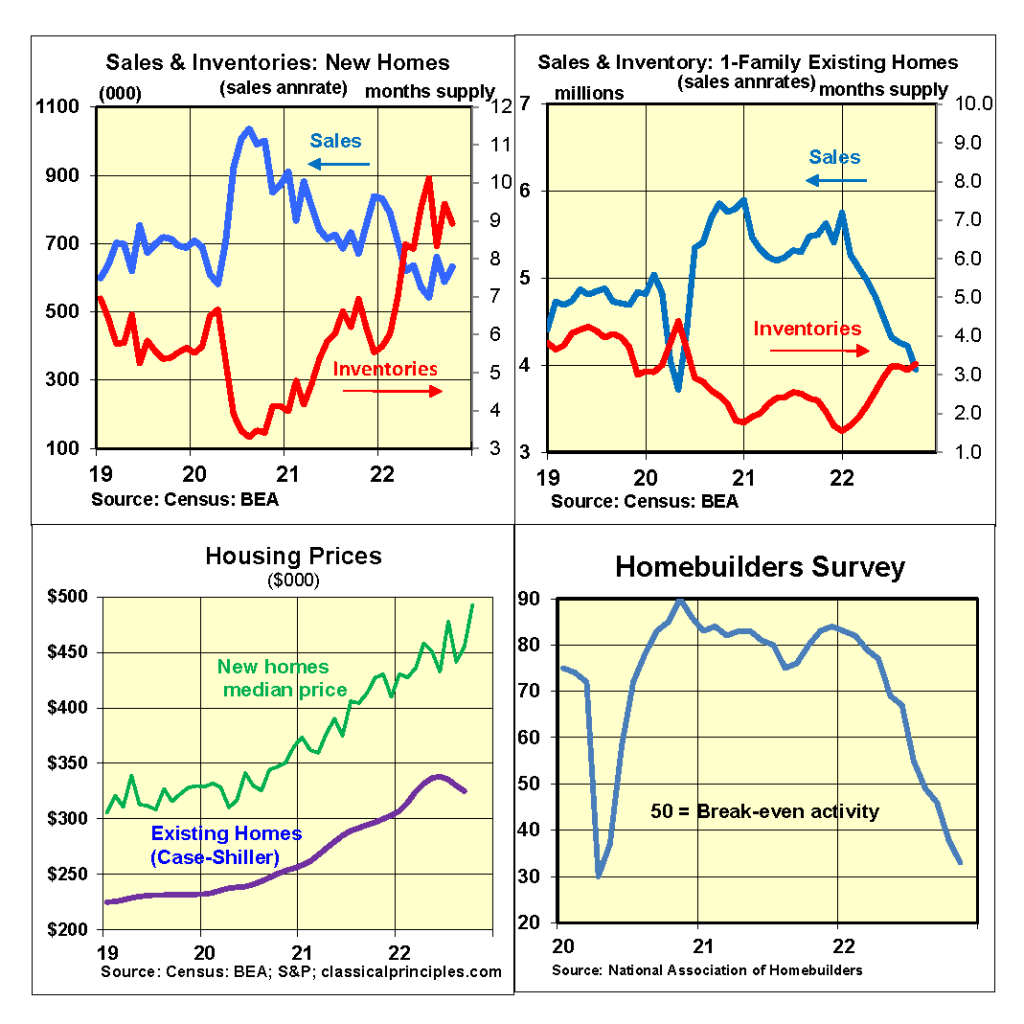
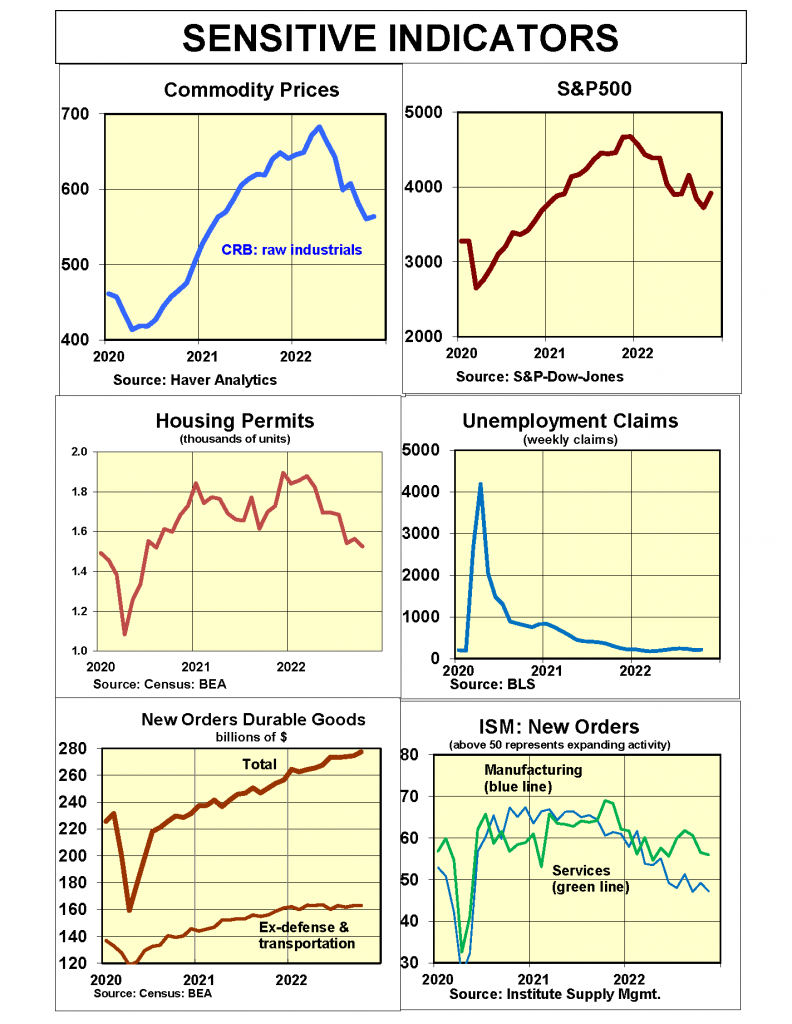
Sensitive short-term indicators remain mostly negative. The two most reliable early indicators—stocks and housing—continue to point to a looming downturn.
Most sensitive indicators for October also point to an upcoming downturn. New orders for durable goods are declining even before allowing for higher prices. The November Homebuilders’ survey plummeted to 33. In addition, the Meyers Report shows shipping volumes in November down close to 50 percent from a year ago.
The one exception to signs of weakness is the November ISM survey of business activity in the service sector of the economy. The ISM November survey showed healthy growth in new orders and backlogs with readings above the mid-50s. An alternative November survey from S&P shows service activity declining for the third straight month with a reading of 46, and a sharp decline in new orders adding to the weakness. The conflicts in these surveys are likely due to surveying different businesses.
While sensitive indicators warn of weakness, most coincident indicators continue to show the economy expanding. The latest Atlanta Fed real growth estimate for the fourth quarter is a strong 3.4 percent, which we believe is too high.
![]()
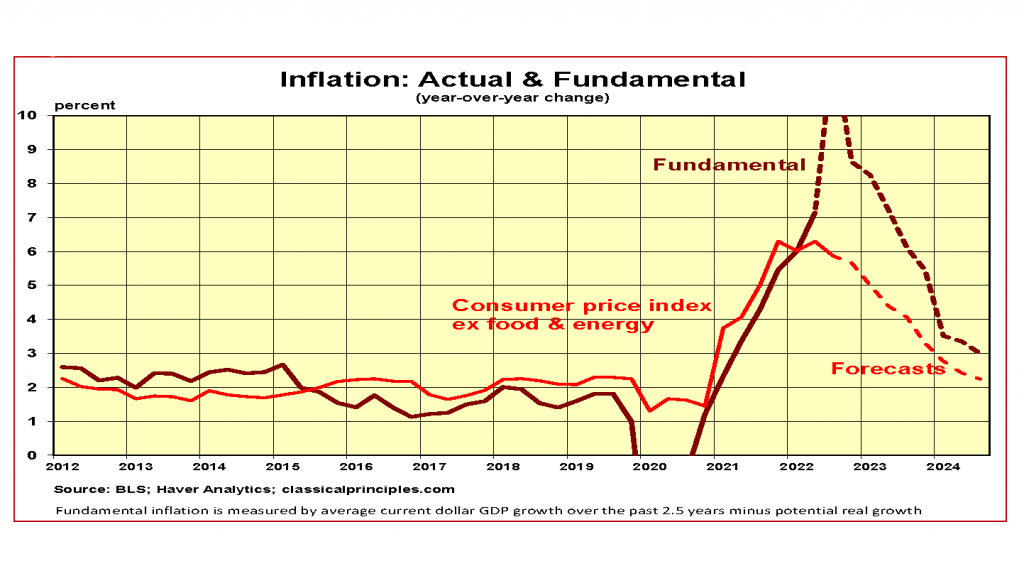
Inflation Forecast
Most commodity prices were flat to down in November. The combination of weaker business activity and an increase in the value of the dollar contributed to reducing price pressures.
Inflationary pressures occur whenever the growth in current dollar spending (GDP) exceeds the growth in output. While there is usually a two-year lag before excess spending increases inflation, sharp changes in spending can be shorter. This happened when the lockdown led to a sharp drop in spending and inflation as well as when the recovery sent inflationary pressures higher.
Current dollar spending (GDP) is the main force dominating future inflationary pressures. In the year ending in the third quarter, spending slowed to 9 percent, down from 12 percent in the year ending in 2021. In the first three quarters of this year, the annualized quarterly rates have been 6.6 percent, 8.5 percent, and 7.3 percent, respectively. An alternative gauge of total output (measured from incomes instead of spending) shows quarterly annual growth rates of 9.2 percent, 8.2 percent and 4.6 percent, respectively.
Our forecast anticipates monetary restraint will produce additional slowing in spending and incomes into 2023. A normal six- to nine-month lag would produce most of the slowdown in the first half of 2023. The extent of the slowdown is speculative. It depends in part on the Fed’s upcoming monetary changes. At this point, we assume the rate of increases in current dollar spending will slow to the 2 percent to 3 percent range.
We anticipate inflation will subside slowly with price increases remaining in the vicinity of 3 percent to 4 percent next year. If the Fed continues its policy of restraint, the slower spending pace is expected to bring inflation down to the Fed’s target of 2.0 percent to 2.5 percent by 2024.
![]()
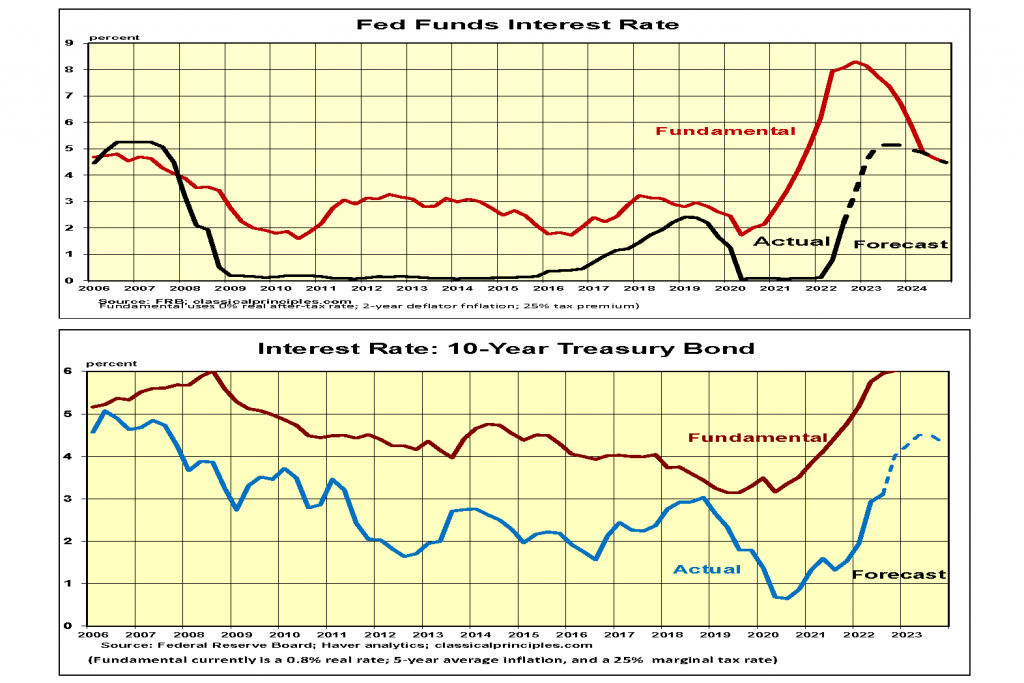
Things to Come
Our assumption of a relatively slow unwinding of inflation means the Fed will have to maintain a restrictive monetary policy through most of 2023. This means further sales of securities and further increases in the fed funds interest rate.
The peak in the fed funds rates will depend on how quickly inflation subsides, the extent of the downturn in the economy, and the Fed’s tolerance for balancing its objectives.
At this point, expectations about the peak in interest rates remain speculative. If the pace of spending comes down as dramatically as we anticipate, and the Fed follows through as markets anticipate, we expect inflation to be in the 2 percent to 3 percent vicinity by 2024.
The recent decline in longer-term interest rates assumes a faster decline in inflation than is likely. We anticipate the likelihood of further increases in interest rates.
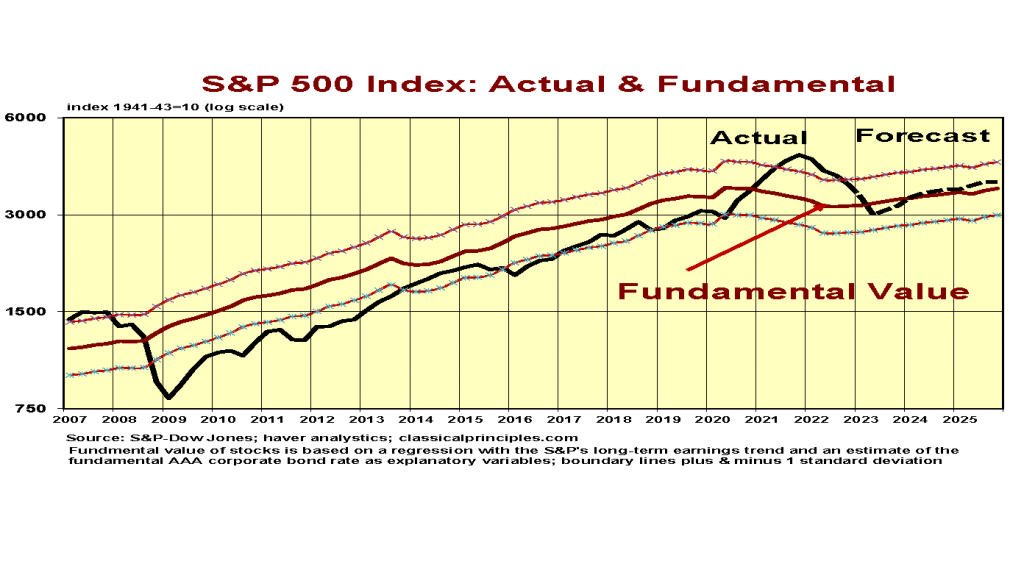
Market Forces
Stock prices have increased by 15 percent from their lows in October while bonds have rallied significantly. Financial markets are behaving as if the Fed easily will succeed in meeting its objective of reducing inflation to the 2 percent vicinity.
While we expect the Fed to be successful in containing inflation, we do not expect it to be quick and easy. Rather the Fed will have to raise interest rates further and hold them high longer than most expect.
Our forecast assumes the upcoming recession will lead to a reduction in corporate sales and earnings. Once the economy begins to decline, unanticipated events can easily send it down further and longer.
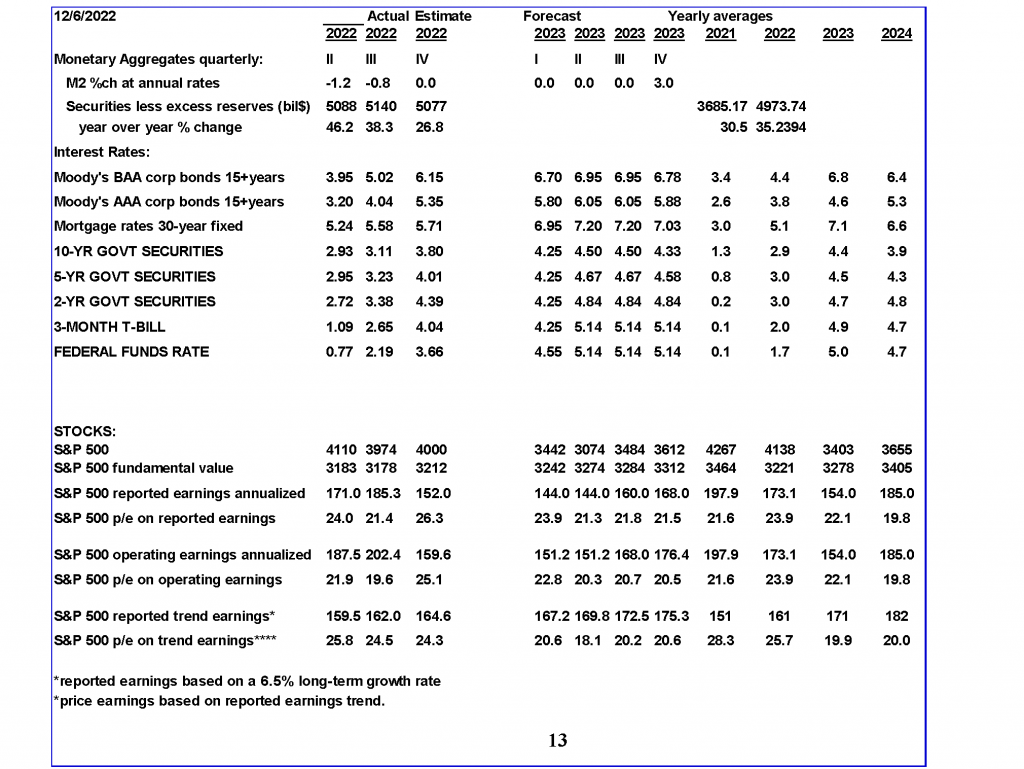
Our stock market model, which uses earnings trends and our estimate for fundamental longer-term interest rates, continues to place the underlying value of the S&P500 in the vicinity of 3200 this year and 3300 in 2023. As a result, the S&P is currently 25 percent overvalued.
An alternative stock market model, using current long-term interest rates, places the value of the S&P500 close to 3800. If longer-term interest rates remain constant or decline, the S&P500 is appropriately valued.
There is a near-term light at the end of the tunnel for stocks, particularly if longer-term interest rates remain close to current levels. However, if our forecast for additional increases in interest rates prevails, stocks will remain vulnerable to continued downward pressure into 2023. If our forecast is accurate, stocks could begin to recover by mid-2023 in anticipation of an easing in monetary policy and a recovery in 2024.
Outlook
Economic Fundamentals: negative
Stock Valuation: S&P 500 overvalued by 25 percent
Monetary Policy: restrictive
For more Budget & Tax News articles.
For more from The Heartland Institute.


")

