


As the Fed’s monetary tightening continues, the economy keeps resisting the usual contraction. Will that continue?
This monthly update includes an analysis of the relationship between money and the economy and how it’s changing. We also present a comparison of the profit trends for small- and mid-cap stocks compared to the S&P500. Finally, there is a brief analysis of the Trump Effect on Stocks from my associate Gary Meyers.
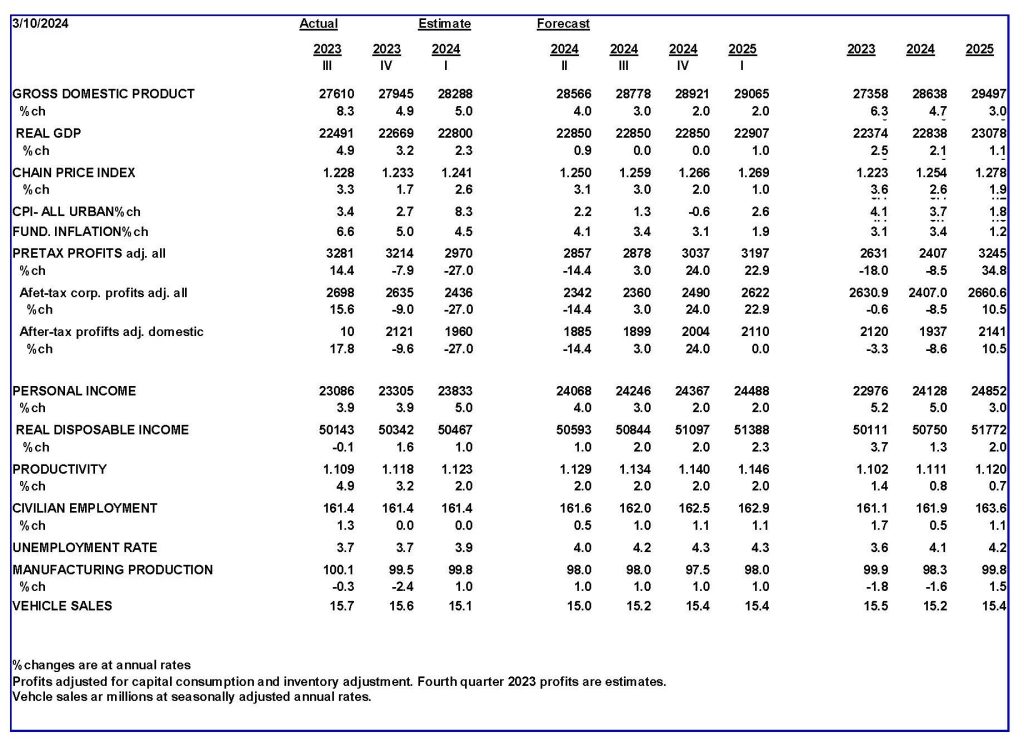
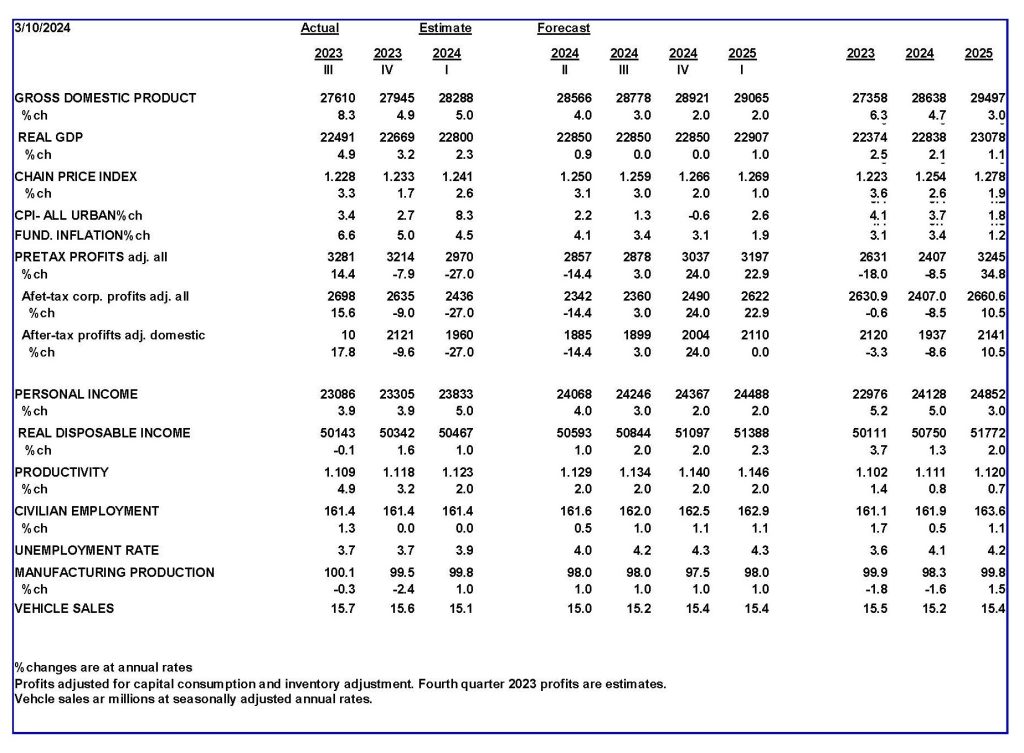
Business surveys show the economy at a real growth rate of about 2 percent per year and inflation in the 3 percent vicinity.
Federal Reserve Chairman Jerome Powell believes the Fed has already done enough to restrain the economy’s growth and contain inflation. He expects the lagging impact of monetary policy to further slow the economy and reduce inflation so the Fed can lower interest rates later this year.
We agree with the Fed’s assessment of the economy. Monetary policy has been restrictive for more than a year and will likely remain so through at least the first half of 2024. While the Fed may start rate-cutting this year, it is unlikely to resume buying securities (and hence expanding the money supply) without signs of a downturn in the economy.
History shows the Fed often has been a destabilizing force in the economy. After 2020, the Fed’s explosive money supply growth created a serious inflation problem. Having created the problem, the Fed has spent the past year and a half removing that same excess money from the economy.
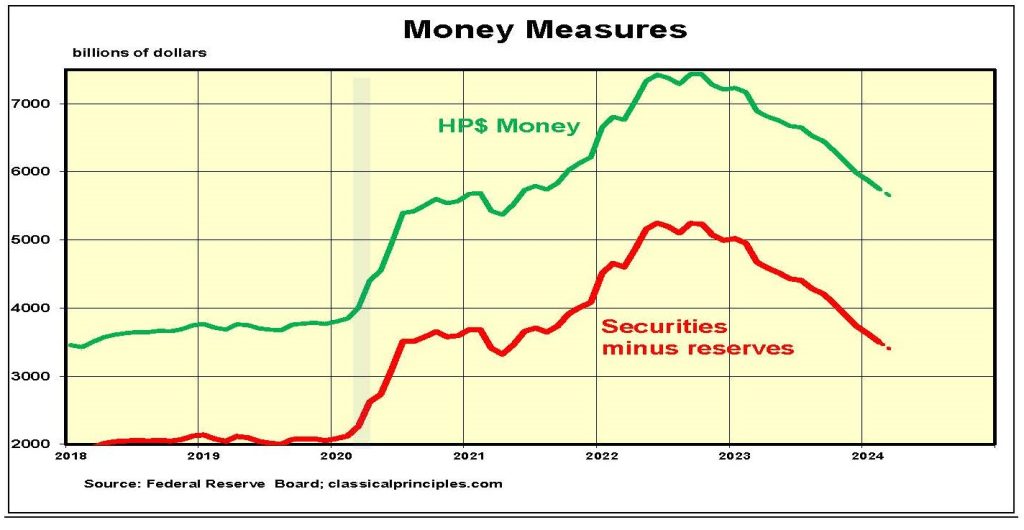
The chart below shows the Fed’s sales of securities, which removes money from the economy. It also shows our preferred money measure, HP$ (currency, Fed holdings of securities and commercial bank deposits at the Fed). As usual, the Fed’s purchases and sales of securities are the main force driving changes in money.
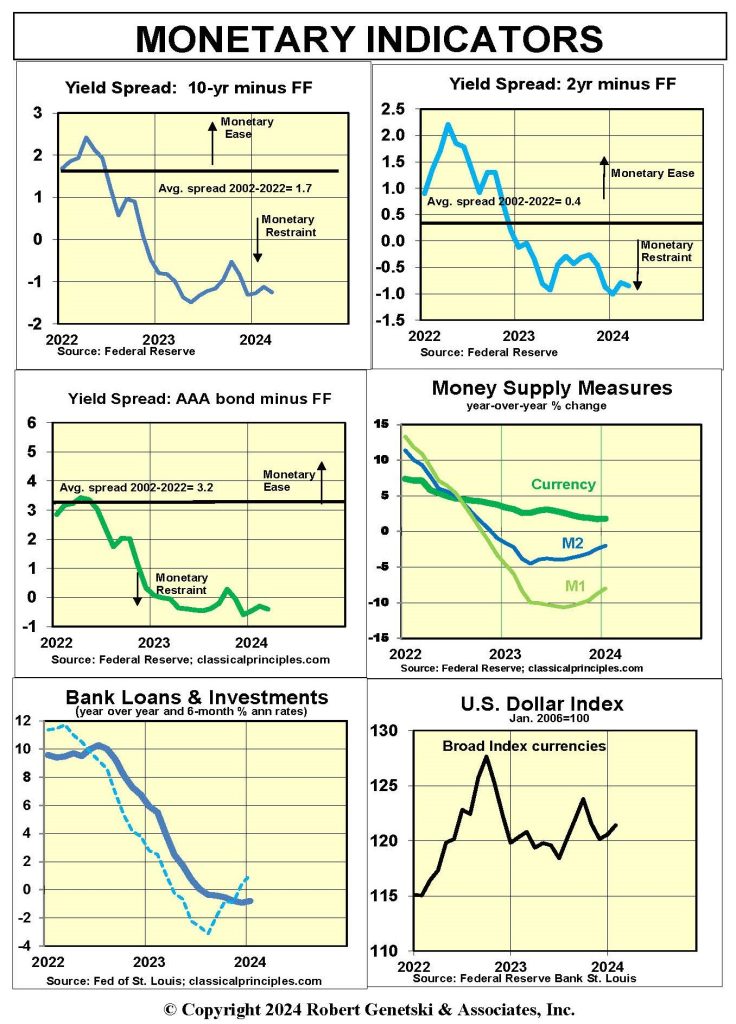
Monetary Indicators
The next chart illustrates the relationship between yearly changes in HP$, M2, and changes in GDP. Historically, the lag between HP$ and GDP has averaged nine to 12 months. The extremes have been from zero to 18 months.
In terms of turning points, the chart below shows how extreme yearly changes in money have been associated with relatively moderate changes in GDP in both directions.
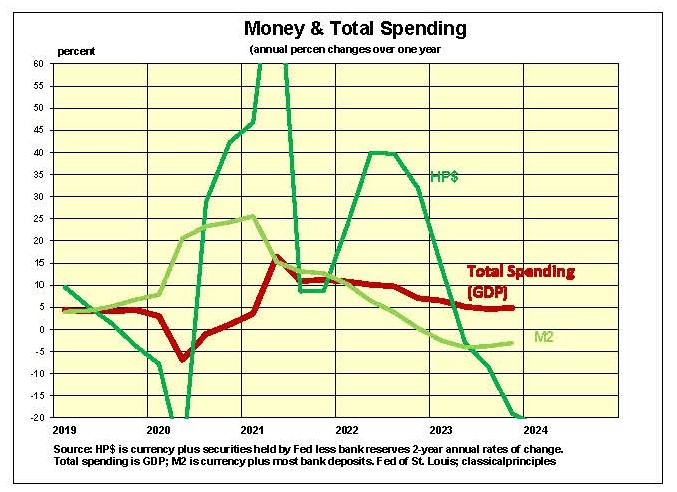
The tendency for money to expand much faster than GDP began in 1990. Since then, Fed policy produced progressively greater extremes for money supply changes. Subsequently, it has taken progressively greater changes in money to alter GDP growth.
A potential mystery is how this shift toward greater volatility impacts the lag between money and the economy.
One thing should be apparent: changes in money do affect the economy. It should also be apparent that monetary policy remains tight.
The Fed is continuing to tighten by selling securities. Charts below show yield curves remain sharply inverted, another clear sign that money is relatively scarce.
More traditional money measures also confirm restraint. Although M1 and M2 have become less reliable as guides to the economy, their growth rates over both the past six- and 12-month periods remain negative.
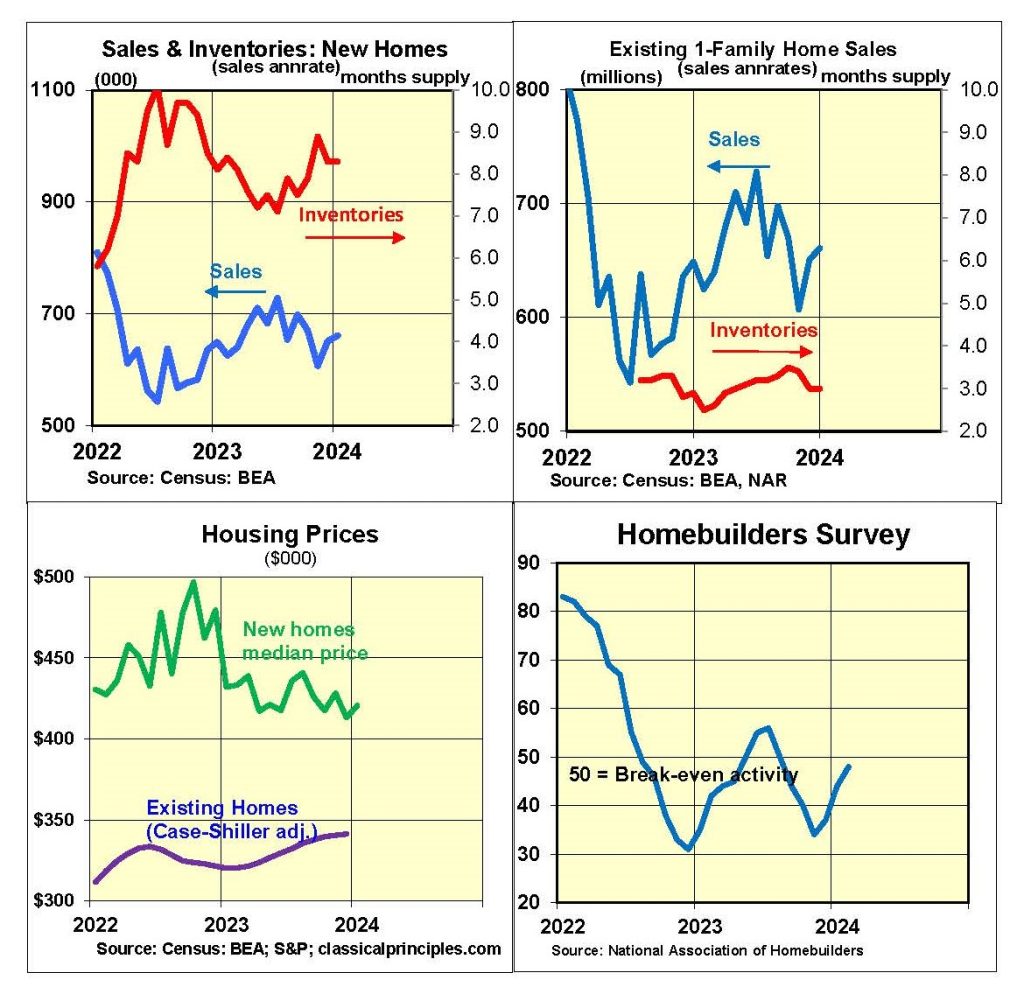
Sharp declines in housing activity and corporate profits also to confirm a tightening of monetary policy. (See the Stock Prices section at the end of this report).
The ongoing boom in stock prices, which usually anticipate future signs of strength, have been mostly associated with AI and its promising benefits. As noted at the end of this report, prices and profits for mid- and small-cap stocks are down sharply.
Monetary restraint has slowed growth in total spending (GDP) and inflation. Yearly changes in GDP peaked at 17 percent in the second quarter of 2021 and are now close to 5 percent. Although the economy has been far more resilient than expected, monetary restraint continues to work its way through the economy.
We continue to expect the slowdown that began with the Fed’s tightening to continue for the next three to nine months.
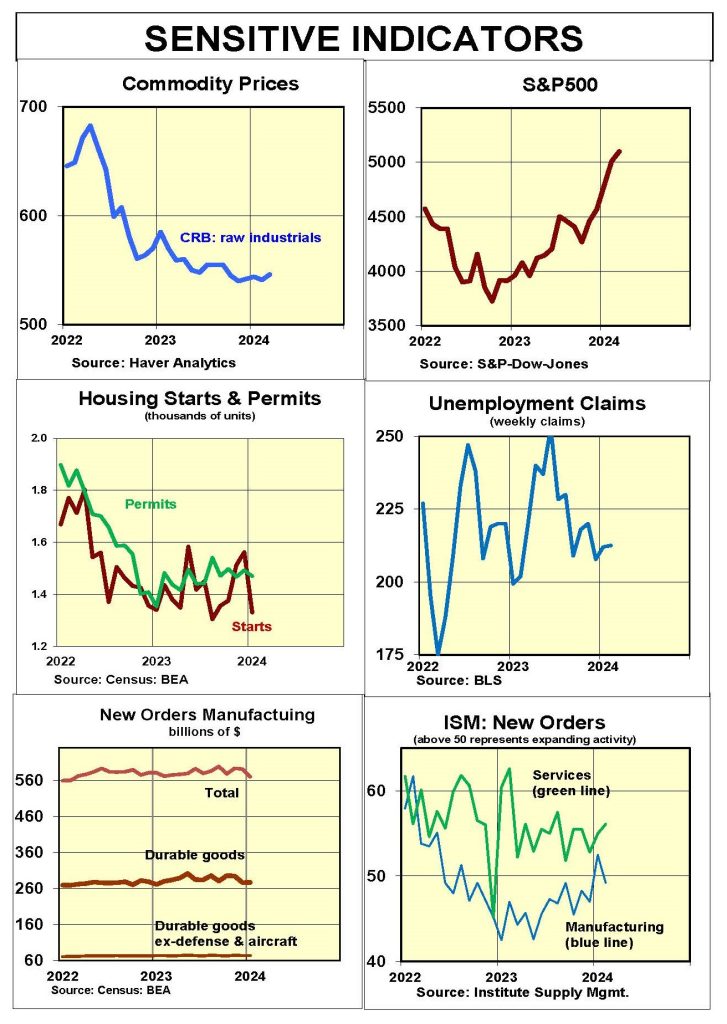
Sensitive Indicators
The up and down nature of monetary policy affects many sectors, which we call indicators. Housing (a most reliable early indicator), has been hit hard. Housing starts, permits, and existing home sales are down 20 percent to 25 percent from early 2022. Despite the weakness, some housing prices have held up due to an increase in costs and a lack of supply.
Raw industrial commodity prices and new orders for manufacturing also have declined.
In contrast, stock prices continue to soar, and the February ISM service company survey shows a rise in new orders. Both point to further strength in the months ahead.
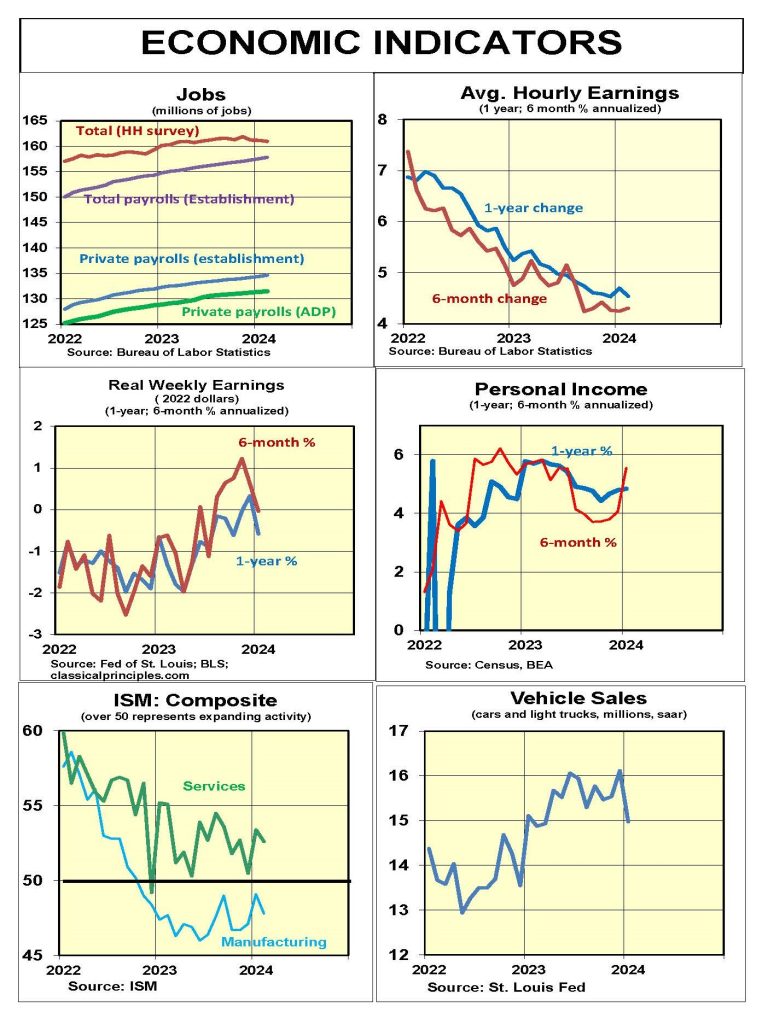
Coincident indicators also show the economy continued to expand in February, with most employment indicators posting moderate to strong growth. ADP payrolls (the most reliable job indicator), show job growth slowed to a 1.2 percent rate in the six months ending in February, down from a 2.5 percent rate in the prior six months.
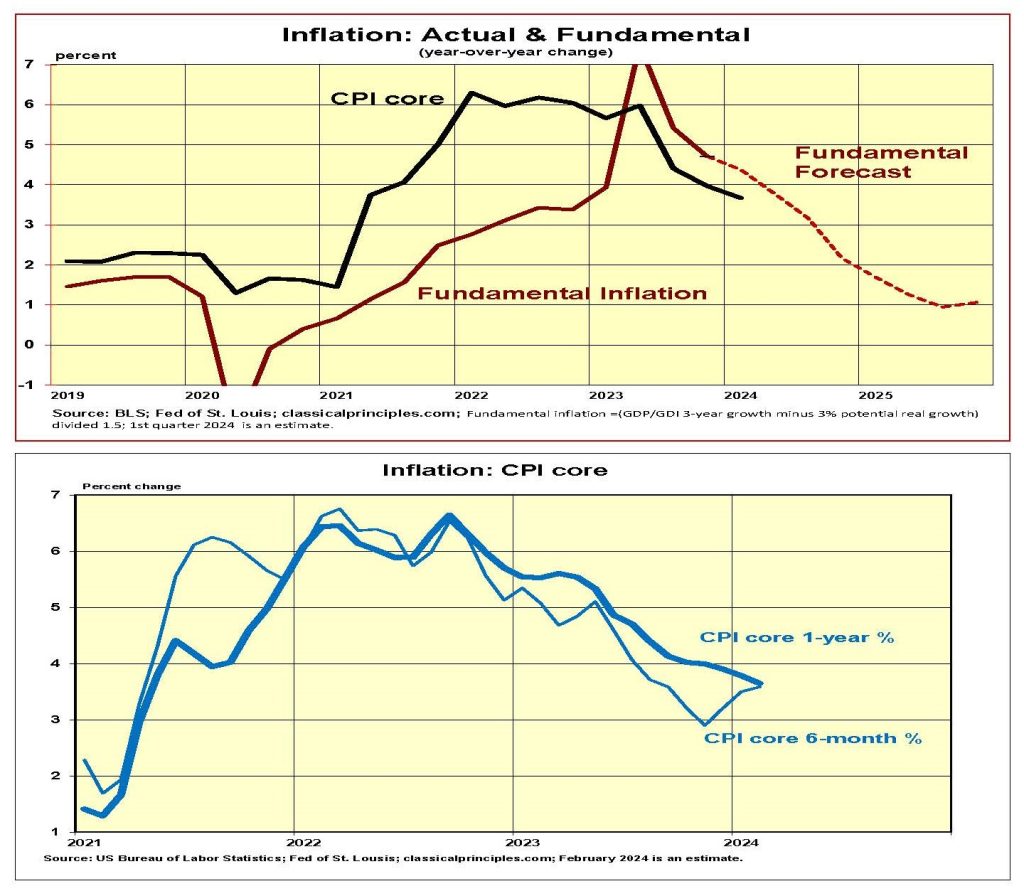
Inflation Indicators
Inflation continues to moderate, albeit gradually. Our estimate of the underlying or fundamental inflation rate shows yearly inflation should currently be 3 percent to 4 percent, then falling to the 2 percent vicinity by the end of this year. The main force driving inflation lower is our projected ongoing slowdown in current-dollar GDP growth.
The second chart shows actual yearly inflation through February (based on the Cleveland Fed’s February estimate). Both the year-over-year and six-month core inflation rates remain in the vicinity of 3½ percent.
This is why Powell insists that interest rate cuts are not likely until the latter half of this year. Expect financial markets to continue to postpone the timing of rate cuts until there are more signs that core inflation is moving closer to the 2 percent vicinity.
![]()
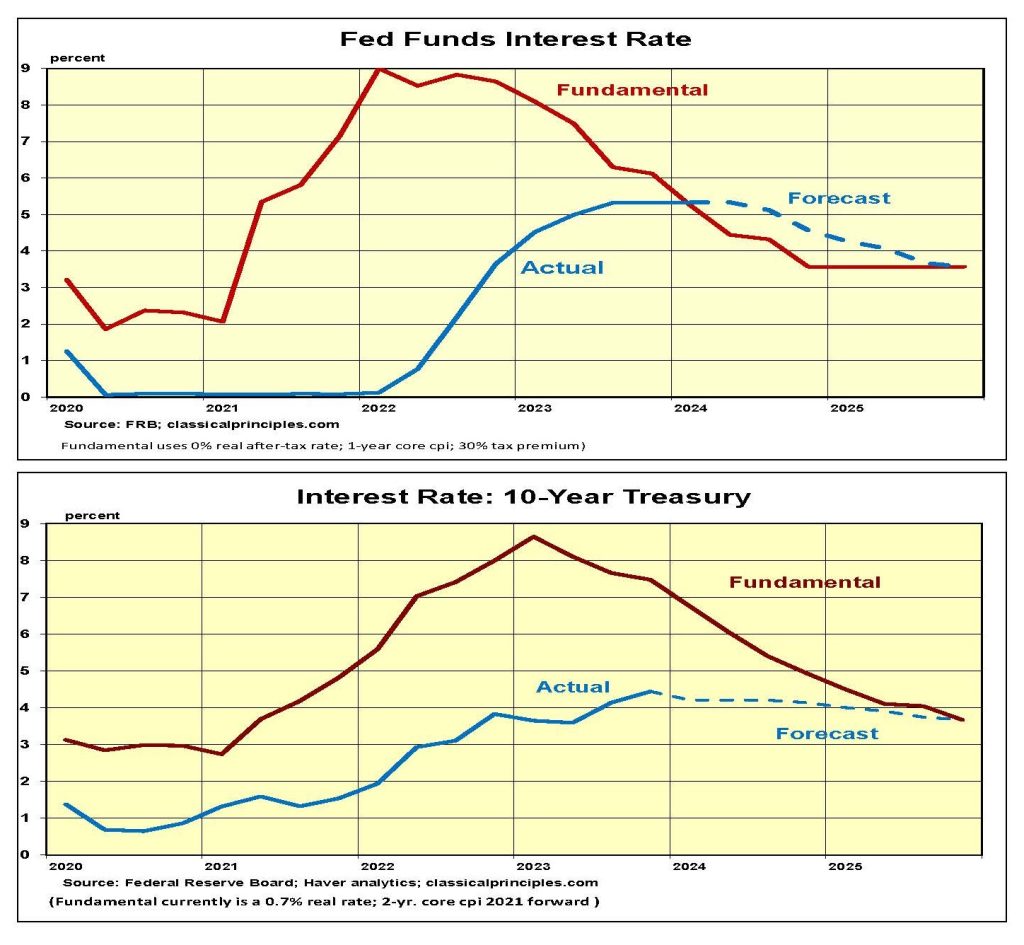
Interest Rates
Our measure of fundamental short and long-term interest rates is based primarily on inflation expectations. As the year-over-year rate of current-dollar spending slows to an estimated 5½ percent in the first quarter of this year, inflation expectations are declining.
Our estimate of the fundamental market rate for short-term rates is moving below the Fed’s interest rate target. It should take another four to six months before the Fed is confident enough about inflation to begin lowering its target rate.
A similar analysis of the fundamental yield on the 10-year T-Note also is slipping towards 4 percent. The speed at which it declines depends on the market’s perception of the Fed’s commitment to reaching its inflation target. We expect the Fed’s indications of inflation-fighting resolve will keep the 10-year Treasury anchored near the 4 percent vicinity for an extended period.
Stock Prices: S&P500
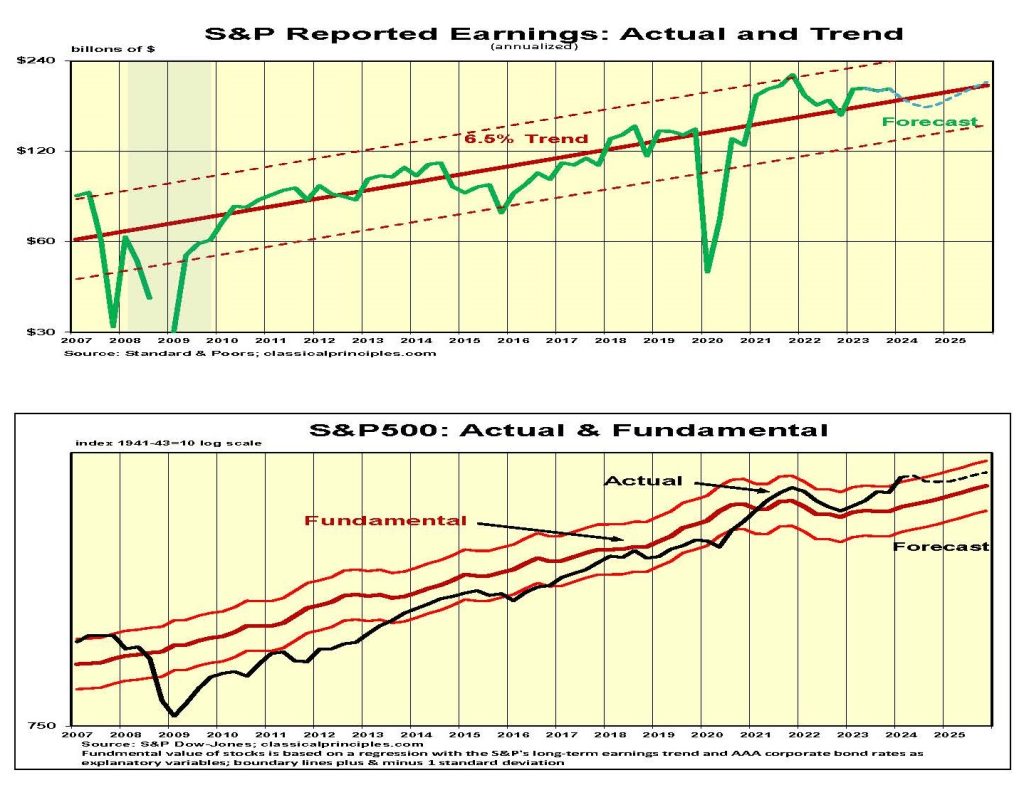
With 98 percent of companies reporting, the S&P500 reported fourth-quarter earnings were up slightly from the third quarter but down 10 percent from their peak at the end of 2021. Profits ended last year at $190.60 per share, producing a fourth-quarter P/E ratio of 23.
Our stock analysis uses reported earnings (based on GAAP). It is a more conservative approach than using operating earnings (which allow companies to write off loses from discontinued operations. Operating earnings tend to be about 10 percent higher than reported earnings. For the fourth quarter of 2023, operating earnings were $212.83 a share, for a P/E of 21.
Our model for the fundamental value of the S&P500 uses the long-term profit trend of 6.5 percent, which dates back to the end of WWII. Fourth-quarter 2023 profits were 10 percent above that longer-term trend. If we were to use actual profits, it would raise our fundamental value of stocks by 10 percent.
The long-term profits trend is used because of natural biases. A strong tendency toward pessimism exists when stocks are selling below fundamental value, while optimism tends to grow when stocks are selling above value. Using the underlying profit trend helps to counter these natural biases by providing a more balanced assessment of risk.
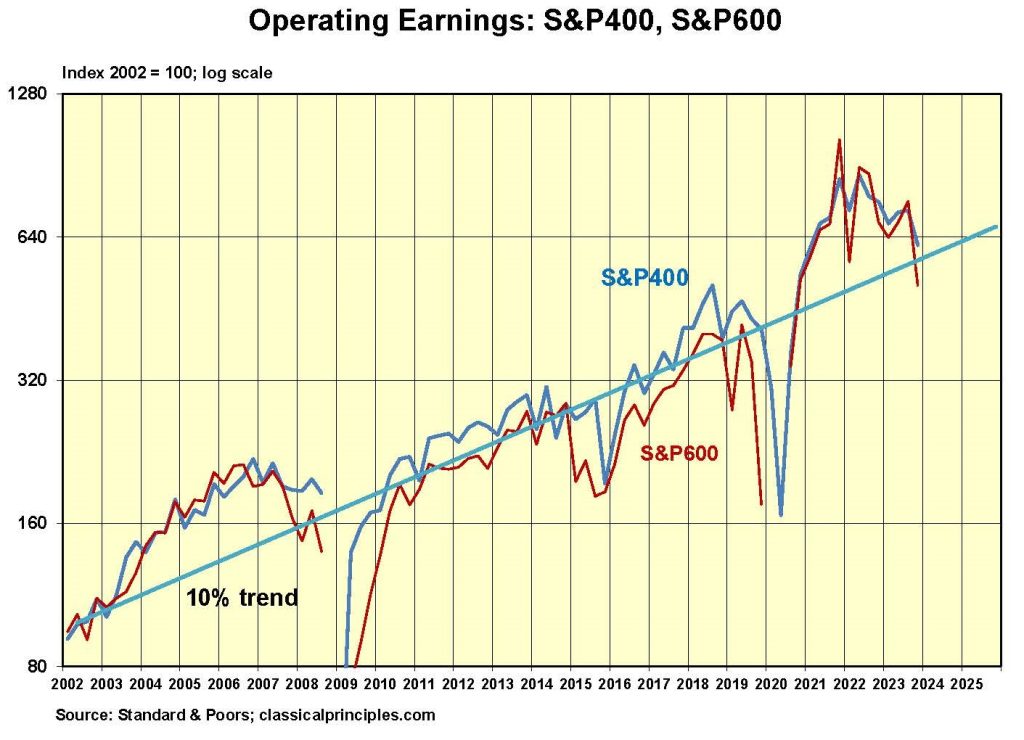
Stock Prices: S&P400 & S&P600
The S&P400 (mid-cap) and S&P600 (small-cap) stock indexes report only operating profits. These stocks tend to be more risky and more volatile than the large-cap stocks in the S&P500.
With greater risk comes the expectation of greater returns over time. Earnings data on the small- and mid-cap indexes is more limited than for the S&P500.
History shows an earnings trend for both small- and mid-cap stocks in the vicinity of 10 percent annually since 2002. This compares to the 6.5 percent longer-term trend for the S&P500.
As expected, along with greater returns, there is more volatility. The blank spaces on the chart below are periods when these companies incurred losses instead of earnings. Negative numbers are undefined on a log scale.
The bottom line is that small- and mid-cap stocks tend to have more rapid earnings growth than large-cap stocks. However, the higher growth means greater volatility and greater risk. Investing in small and mid-cap stocks will tend to produce larger returns, particularly if you can weed out the many smaller companies with disappointing earnings performance.
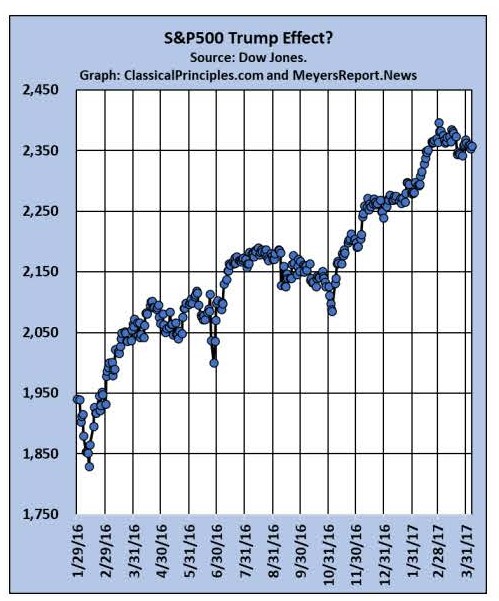
The Trump Effect?
Here is an interesting alternative view on the stock market from my associate Gary Meyers.
In addition to profit reports and other stats, stock markets also move on sentiment.
Immediately after the 2016 election on November 8, 2016, the stock market bulls started to run up the score. The question is why? It seemed that the “smart money” knew what was coming—strong economic growth from reduced regulation, increased energy production, and the possibility of more peace in the world, even in the Mideast.
The reason was that the smart money was betting that a President Trump was an organized, strong, disciplined leader who would get results.
On March 4, 2024, the U.S. Supreme Court ruled that state officials could not arbitrarily and unilaterally remove a presidential candidate from the ballot.
The shockwaves were immediate. The stock market kept moving higher, despite the threat of higher inflation and higher interest rates in the near term.
Even Nouriel Roubini, who built a career of predicting economic calamities was turning bullish. He is most famous for predicting at least seven of the last two recessions.
Following the smart money, I predict that Donald Trump will be elected the next President of the United States. Assuming that happens, the following will occur:
- The border will be shut down in less than a a month. Our own experts tell us it can be done in two days—if the border patrol and others are allowed to do their jobs.
- U.S. oil companies will increase their production because regulations will be lifted and suspended oil leases will be reopened. The oil companies have been preparing by investing big money in our most productive oil fields for a year. They never lost faith.
- Reduced farming regulations will improve our farming production for a hungry world left short of food by unnecessary wars and devastating climate polices that have slaughtered our meat producers and grain growers.
- Inflation will come down dramatically, because energy prices will come down and with that the cost of production for most of our products, especially food, will decrease.
- Our increased production of food and energy will mean more exports to a world that continues to starve itself through self-destructive climate farm policies. What is the point of saving the world if you starve the people?
- Peace will break out because our leadership will be strong, as it was in the last administration. Remember, our own Roundtable members operating in the Mideast told us that peace there was about to happen but was sabotaged either through intent or stupidity.
However, if Trump does not get into office, the above forecasts could go the exact opposite way.
For more great content from Budget & Tax News.
For more from The Heartland Institute.


")
