

YOU SHOULD SUBSCRIBE TO CLIMATE CHANGE WEEKLY.
IN THIS ISSUE:
- Surveys Show Vast Bulk of Antarctica Is Stable or Growing
- Video of the Week: Sea Level Rise: A Measly 1.2 Inches Every Decade
- NOAA’s “Billion Dollar Disaster” Reporting Lacks Scientific Integrity and Rigor
- Podcast of the Week: Creation of “Chief Heat Officers” in Arizona
- Climate Comedy
- Recommended Sites
Watch ALL the Presentations by the ALL-STARS of Climate Realism at the Archive of Heartland’s 15 Climate Conferences

Surveys Show the Vast Bulk of Antarctica Is Stable or Growing
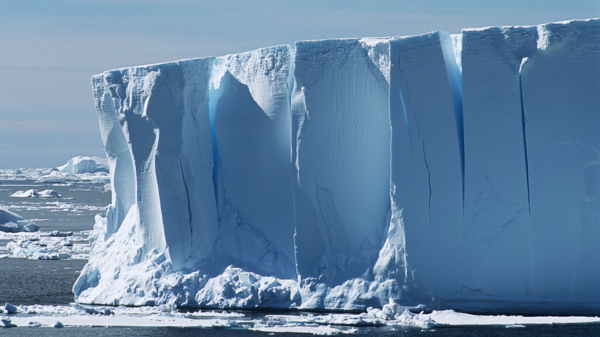
We hear a lot in the mainstream media about massive ice loss in Antarctica and how it may radically increase sea level rise. The West Antarctic ice sheet and ice on the Antarctic peninsula are in decline, with some massive glaciers threatening to break off; however, conditions there are not the same as for the vast bulk of the continent. First, the subsurface geothermal/volcanic activity that is driving much of the melting in West Antarctica is not affecting the vast bulk of the continent. And the shifting ocean oscillations, which affect the continent’s climate as a whole, have a much greater, more direct impact on the Antarctic peninsula, the northern-most part of the continent, a relatively narrow spit of land surrounded by oceans and beset be clashing currents.
The conditions of the sea ice around Antarctica don’t matter in the sea level equation. Sea ice changes dramatically each season, waxing and waning with the seasons and the currents. For the limited period for which we have consistent measurements, Antarctica’s sea ice has set new records for extent and for low levels during the most recent period of climate change. Neither, however, impact sea levels since floating ice doesn’t displace water.
NASA reported in 2015 that because East Antarctica, which makes up the bulk of the continent, was adding ice and snow, Antarctica as whole may, in fact, be gaining ice on net, implying it could be modestly taking away from sea level rise rather than adding to it. At least from 1992 to 2015, when the report was published.
Recent research using updated data lends some credence to NASA’s earlier claims of ice growth across the vast bulk of the continent. An international team of researchers, from universities and research institutes in Denmark, France, and Norway, published a paper in Nature Communications examining the glacial ice mass balance across East Antarctica.
Part of the research consisted of examining a “large-scale, aerial image archive of Antarctica to provide a unique record of 21 outlet glaciers along the coastline of East Antarctica since the 1930s.” The records consist in part of 300 aerial images run through digital elevation models (DEMs) to reconstruct historic ice thickness and extent.
They found a mix of trends with ice in different glacial outlets thickening, thinning, and remaining relatively constant stasis for long periods of time at different periods of time.
Overall, there was no declining trend in fixed ice on land, and perhaps even net growth across East Antarctica, where “[ice] losses have primarily occurred in some of the marine-based catchments in Wilkes Land, and are largely attributed to the intrusion of modified Circumpolar Deep Water. The terrestrial catchments, where the majority of the ice is grounded above sea level, have recently shown a mass gain caused by increased accumulation.”
Overall, decades-long increases, decreases, and stable trends in ice levels did not correspond at all to carbon dioxide emissions, atmospheric concentrations, or global average temperature trends. Rather:
In all regions, the long-term changes in ice thickness correspond with the trends in snowfall since 1940. Our results demonstrate that the stability and growth in ice elevations observed in terrestrial basins over the past few decades are part of a trend spanning at least a century, and highlight the importance of understanding long-term changes when interpreting current dynamics.
Looking at specific glaciers, they found, for example:
Despite large variations in size and characteristics, all six glaciers in Lützow-Holm Bay experienced a net retreat between 1937 and the 1980s, when they reached an almost simultaneous minimum associated with a complete break-up of fast ice in the bay. Another smaller retreat phase occurred around the mid-2000s, with the exception of Shirase, and again during 2016. By far, the largest fluctuations are observed at Shirase Glacier with a total range of almost 90 km in the ice-front position from its 1963 maximum to its minimum in 1988. In contrast, Langhovde and Hovdebreen Glacier show frontal variations of less than 1 km between 1937 and 2023. Since the retreat in the 1980s, all glaciers except Langhovde and Honnörbrygga have, at some point, advanced to a similar marginal position or even extended beyond their extent recorded in 1937.
Overall, East Antarctica has experienced regional frontal fluctuations along the shore, with some loss, and long-term ice thickening of ice and snow onshore. For example, they write:
Our observations show no regional long-term trend in the frontal positions of the studied glaciers in Kemp Land, Mac Robertson Land, and along Ingrid Christensen Coast between 1937 and 2022. The glaciers fluctuate between periods of frontal advances and retreats of varying distances (<0.1 km to 13.5 km) and intervals (3–50 years). Most noticeable is the 13.5 km advance of Mulebreen Glacier since the 1980s and the retreat of Jelbart Glacier, which is 3.5 km short of its 1937 marginal position.
From the historical DEMs, we observe an overall thickening of the glaciers in Kemp and Mac Robertson Land between 1937 and 2021 and along Ingrid Christensen Coast between 1960 and 2021 (Fig. 2, Fig. S23). In Kemp and Mac Robertson Land, the largest changes are observed at Hoseason and Taylor Glacier, with an annual average surface elevation increase of +0.23 m/yr ± 0.07 m/yr and of +0.11 m/yr ± 0.05 m/yr since 1937, respectively.
Concerning climate change’s impact on East Antarctic’s glaciers, the study reports, “[o]verall, there has been no significant trends in annual or seasonal mean air temperature in East Antarctica since the 1950s, and mean austral summer air temperature (December to February) from stations in all regions rarely exceeds 0 °C.
“While previous research on Antarctic snowfall found no statistically significant changes since the 1950s, recent studies utilizing compiled data on ice core records indicate increased Antarctic-wide snow accumulation during the past 200 years,” the study says.
Anyway you cut it, this research lends no credence to any forecast that Antarctica’s vast store of ice is about to melt and raise sea levels.
Source: Nature Communications
NEW: Get Climate at a Glance on your mobile device!

Video of the Week
Heartland Institute Research Fellow Linnea Lueken looks at sea level rise, and whether or not it poses an existential threat to coastal communities. That data: NASA satellite readings that date back to 1993 show that sea level rising at a pace of just 1.2 inches every decade, and older records from tide gauges show a rate of about 1 foot per century. Hardly an existential threat, let alone one to the world’s coastal cities.
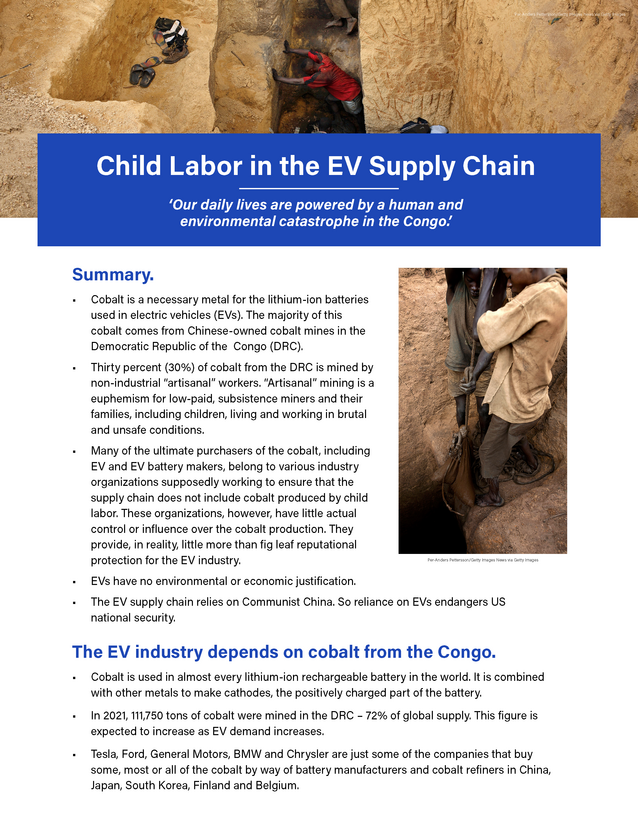
Read the brutal truth about how battery production for electric vehicles cause immense environmental destruction and human tragedy.
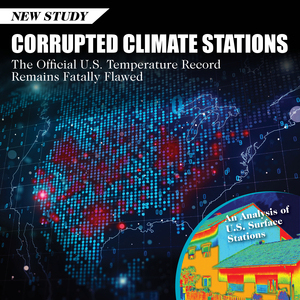
NOAA’s “Billion Dollar Disaster” Reporting Lacks Scientific Integrity and Rigor
New research published in the peer-reviewed Nature journal Natural Hazards, debunks the National Oceanic and Atmospheric Administration’s (NOAA) methods for calculating “billion-dollar disasters,” which the agency and other agencies, politicians, and activists cite as evidence of the growing impact of climate change, and the need for carbon dioxide restrictions.
In the paper, Roger Pielke, Jr., Ph.D., demonstrates that NOAA’s tabulation of costs fails to meet the agency’s own standards for information quality and scientific integrity, making it unsuitable for use in the detection and attribution of trends in extreme weather, much less attributing them and costs stemming from them to human-caused climate change.
Pielke explains why addressing NOAA’s billion-dollar disaster claims are important, writing in his Substack site that:
In the late 1990s, the U.S. National Oceanic and Atmospheric Administration (NOAA) began publishing a tally of weather and climate disasters that each resulted in more than $1 billion in damage, noting that the time series had become “one of our more popular web pages.” …
By 2023, the billion-dollar disaster time series had become a fixture in NOAA’s public outreach, was highlighted by the U.S. government’s U.S. Global Change Research Program (USGCRP) as a “climate change indicator,” was cited as evidence in support of a “key message” of the Fifth U.S. National Climate Assessment showing that “extreme events are becoming more frequent and severe.”
The time series is often cited in policy settings as evidence of the effects of human-caused climate change to increase the frequency and intensity of extreme weather events and associated economic damage, including in federal agencies, Congress and by the U.S. President. In addition , . . , as of March, 2024, NOAA’s billion-dollar dataset has been cited in almost 1,000 articles according to Google Scholar. …
[T]he “billion-dollar disaster” list was somehow transformed into “data” used in peer-reviewed research, an official indicator of human-caused climate change featured by the U.S. National Climate Assessment and used by the administration of President Joe Biden to justify a wide range of regulations and policy.
As Pielke describes it, NOAA is concerned that its reports on weather damage be treated as “influential information,” which “means information the agency reasonably can determine will have or does have a clear and substantial impact on important public policies or private sector decisions.” This desire to influence policy takes precedence, indeed, seemingly determines, the extent to which NOAA complies with its own guidelines for quality data, and the transparency and accuracy of the outcomes it produced.
NOAA’s Information Quality Guidelines is composed of three criteria intended to ensure information quality: utility, objectivity, and integrity. Pielke only briefly discusses NOAA’s failings with regard to the integrity of its disaster assessment, noting that the agency’s rules require its work to undergo a transparent, peer-review process with public disclosure of the planning for forthcoming research—a requirement that NOAA has failed to comply with in the rush to put out annual reports using data and methods that have shifted over time. Pielke focuses most of his analysis/critique on the first two criteria, utility and objectivity, finding NOAA’s analysis fails on both counts. Per NOAA’s guidelines:
Utility refers to “the usefulness of research to its intended users, including the public,” with an emphasis on “transparency.” NOAA’s Scientific Integrity Policy provides further guidance: “Transparency, traceability, and integrity at all levels are required” in order for the agency “to achieve” its mission (https://www.noaa.gov/sites/default/files/legacy/document/2021/Feb/202-735-D.pdf).
-
- Traceability: “The ability to verify sources, data, information, methodology, results, assessments, research, analysis, conclusions or other evidence to establish the integrity of findings.”
- Transparency: “Characterized by visibility or accessibility of information.”
Objectivity refers to presentation and substance:
-
- Presentation: “includes whether disseminated information is presented in an accurate, clear, complete, and unbiased manner and in a proper context.”
- Substance: “involves a focus on ensuring accurate, reliable, and unbiased information. In a scientific, financial, or statistical context, the original and supporting data shall be generated, and the analytic results shall be developed, using sound statistical and research methods.”
Sounds good in theory, the problem is NOAA doesn’t follow its own rules in practice. As Pielke writes:
The NOAA billion-dollar disaster dataset is intransparent in many ways, including its sources, input data and methodologies employed to produce results. The intransparency includes elements of event loss estimation, additions to and subtractions of events from the database, and adjustments made to historical loss estimates. There have been an unknown number of versions of the dataset, which have not been documented or made publicly available. Changes are made to the dataset more frequently than annually, suggesting that there have been many dozens of versions of the dataset over the past decades. Replication of the dataset or changes made to it is thus not possible by any independent researcher, as is verification or evaluation of the dataset itself.
For example, NOAA says it utilizes more than a dozen sources of estimates to calculate disaster costs, without detailing how the estimates are tied to specific events or what methodologies and assumptions the sources used to develop their cost estimates. NOAA also says it accounts for indirect losses from extreme weather events without explaining what “indirect” losses are included or how they are calculated.
Aside from the problems with data utility due to a lack of transparency, NOAA’s billion-dollar disaster claims display a lack of objectivity, since it regularly asserts that climate change is causing more extreme weather events, with the proof being rising costs. This commits the logical fallacy of the result proving the cause, post hoc ergo propter hoc (Latin for: “after this, therefore because of this”). NOAA provides no evidence that weather is getting more extreme, or that any particular weather event has been caused by climate change driven by human greenhouse gas emissions, thus it is fallacious to assume that rising disaster costs are due to climate change. The latter effect can have many causes.
In fact, NOAA billion-dollar disaster time series provide no evidence of detection or attribution of changes in the climate or extreme weather events in the United States, and economic loss data resulting from extreme weather events is not suitable to that purpose because losses involve more than just climatic factors. NOAA does not account for the expanding bullseye effect of populations moving to locations and developing greater infrastructure in areas historically prone to natural disasters.
In fact, Pielke points out that more than 60 studies have examined this issue, and when taken in total and costs from disasters are normalized not just for inflation but for increased exposure, losses per disaster as a percentage of GDP have declined 80 percent since 1980 alone.
Pielke describes multiple other examples of ways NOAA violates its data integrity guidelines, and has proposed eight steps to improve NOAA’s disaster cost reporting, making its reports fit for purpose, and for use in informing policies:
-
- Publish all data, including all versions of the dataset;
- Document and publish baseline loss estimates and their provenance;
- Clearly describe all methodologies employed to adjust baseline data;
- Document every change made to the dataset, give each successive version of the dataset a unique name, and publish all versions of the data;
- Maintain all historical versions of the dataset in a publicly accessible archive;
- Subject the methods and results to annual peer review by experts, including economists and others with subject matter expertise, who are independent of NOAA. Make the peer-review reports public;
- Align NOAA’s practices with federal government policies for disseminating statistical information that are applied to other agencies;
- Align claims with IPCC methods and standards for any claims of detection and attribution, or justify why the claims are at odds with those of the IPCC.
Sounds like a good start to me.
Sources: NPJ Natural Hazards (Nature); Climate Change Dispatch
Heartland’s Must-read Climate Sites


Podcast of the Week
Phoenix is hiring a “Chief Heat Officer,” in response to rising heat related deaths, which the city blames on climate change. The truth is most of those dying are homeless or drug addicts with underlying health conditions, people already in poor health. As far as Phoenix’s heat, that is due, not to climate change but the city’s massive growth and related increased Urban Heat Island effect. Responding to homelessness and drug use will do far more to prevent premature deaths in Phoenix than efforts to fight climate change or control the weather.
Subscribe to the Environment & Climate News podcast on Apple Podcasts, iHeart, Spotify or wherever you get your podcasts. And be sure to leave a positive review!


")

