


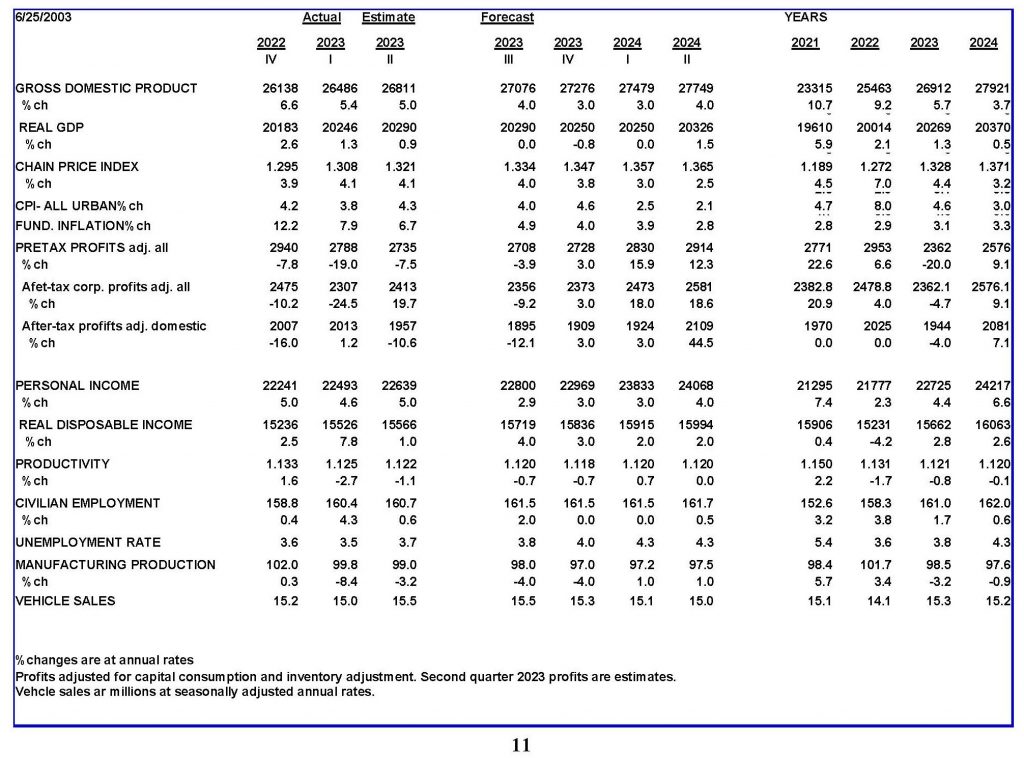
With two-thirds of fiscal 2023 completed, the U.S. Treasury reports federal tax receipts are down 11 percent from the previous year, suggesting the economy is weaker than either the gross domestic product or gross domestic income numbers indicate.
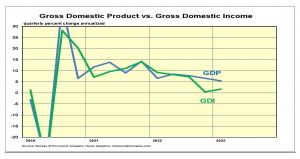
The Bureau of Economic Analysis has two current-dollar measures of the economy. The gross domestic product (GDP) measures the total amount spent on final goods and services. The lesser-known gross domestic income (GDI) measures the income earned producing the goods and services purchased. Conceptually, they should add up. They seldom do.
Both measures are rough estimates of the size of the economy based on limited samples. In the two quarters ending in Q1 2023, the “income” measure shows only a 1 percent rate of increase, while the spending size measure shows a 6 percent rate. Allowing the 4 percent inflation rate, these measures put real growth between -3 percent and 2 percent. When averaged, the two measures indicate real growth was essentially zero.
Given past uncertainty, we should be skeptical about the Atlanta Fed’s estimate of a 2 percent growth rate for the quarter now ending. Many economic estimates are based on soft numbers. One hard number estimate comes from the Treasury’s monthly report on tax receipts. With two-thirds of fiscal 2023 completed, the Treasury reports tax receipts down 11 percent from the previous year. Tax receipts are highly erratic and difficult to interpret. Nonetheless, these data through May point to a weaker economy than either the GDP or GDI would suggest.
Monetary Indicators and the Economy
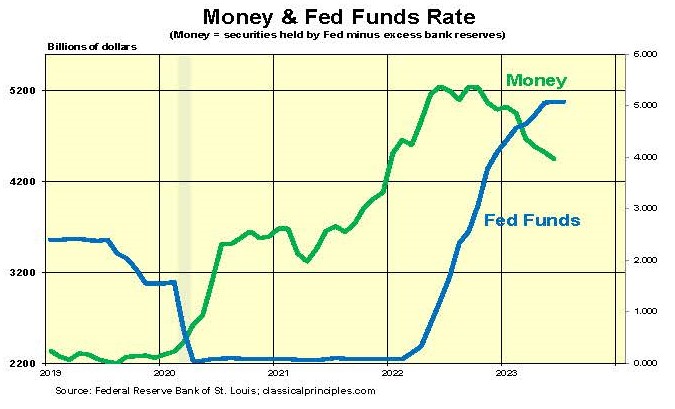
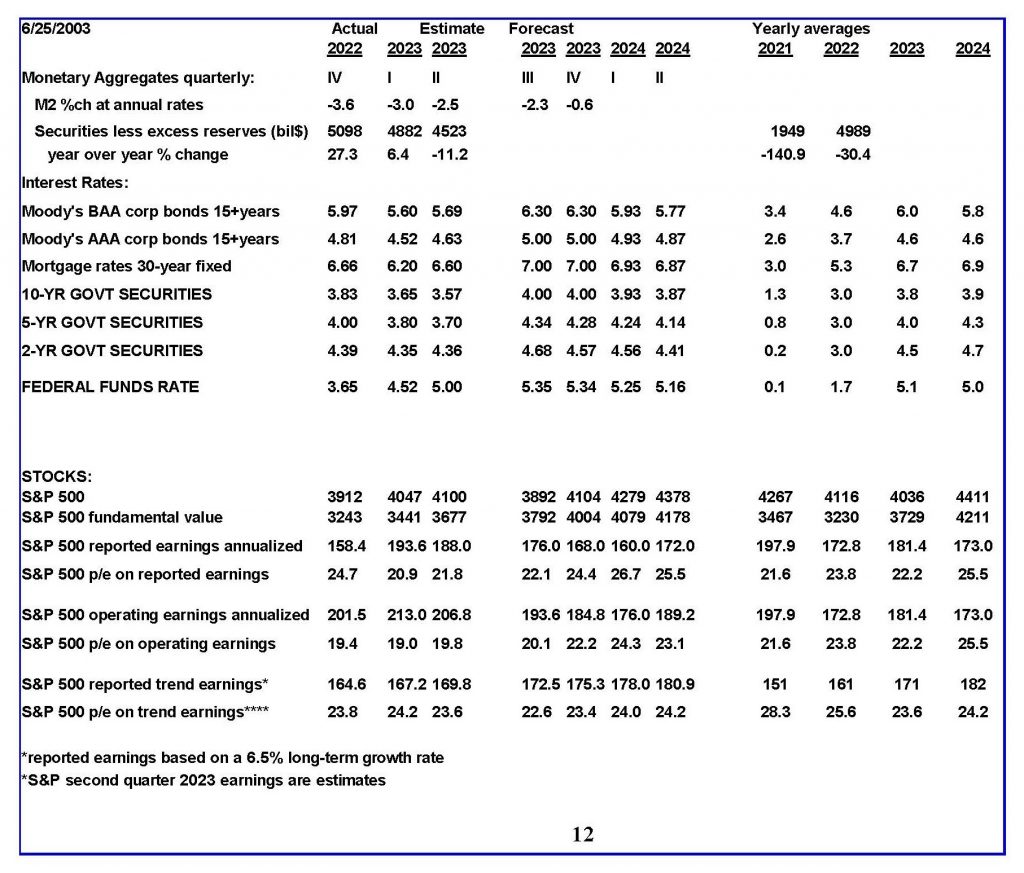
The chart below shows the changing money supply resulting from changes in the Fed’s holdings of securities and shifts in bank deposits at the Fed. As of the 3rd week in May, money is down 15 percent from a year ago but still up 20 percent from two years ago.
The dramatic surge in the money supply from mid-2021 to mid-2022, followed by the sharp decline this past year, has made it difficult for businesses and investors to assess the impact on the economy.
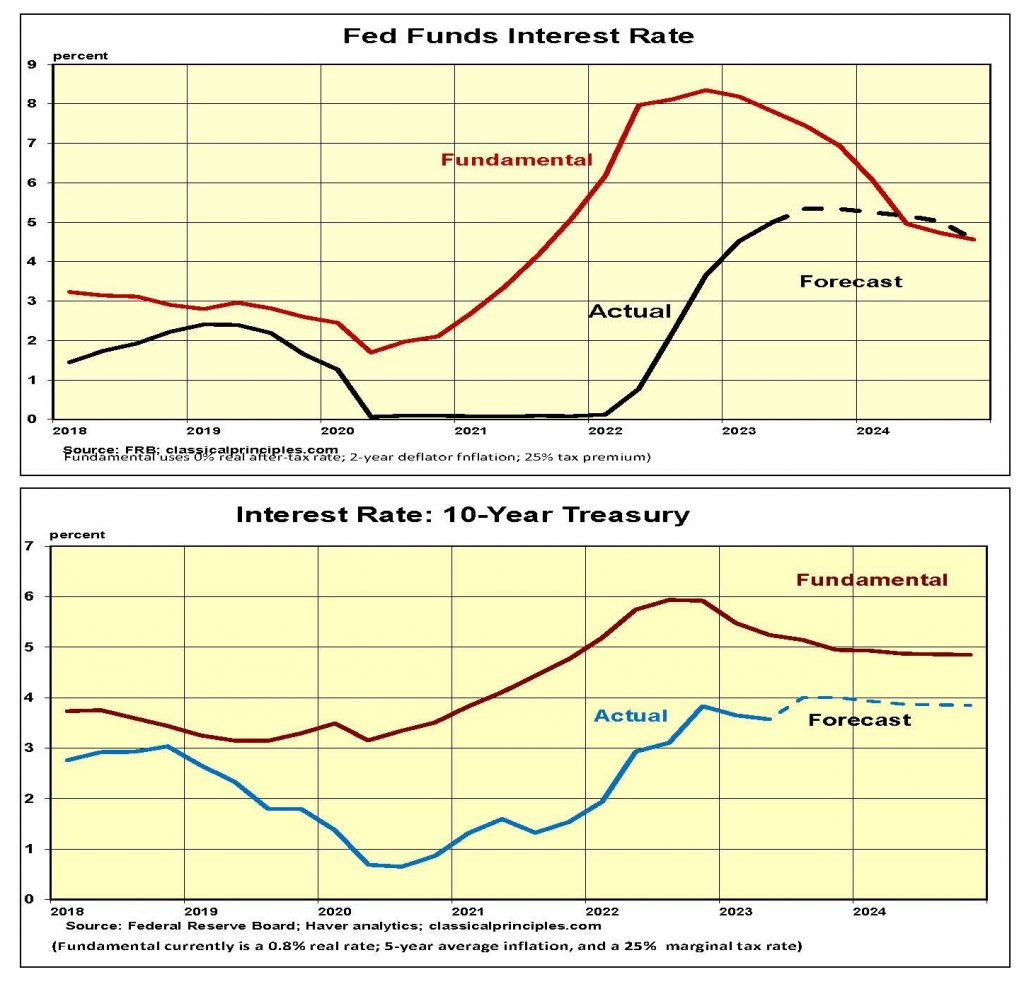
Interest rates have responded to the erratic shift in money in a normal manner. A leveling off in the money supply in the summer and fall of 2022 was accompanied by the sharp increase in interest rates.
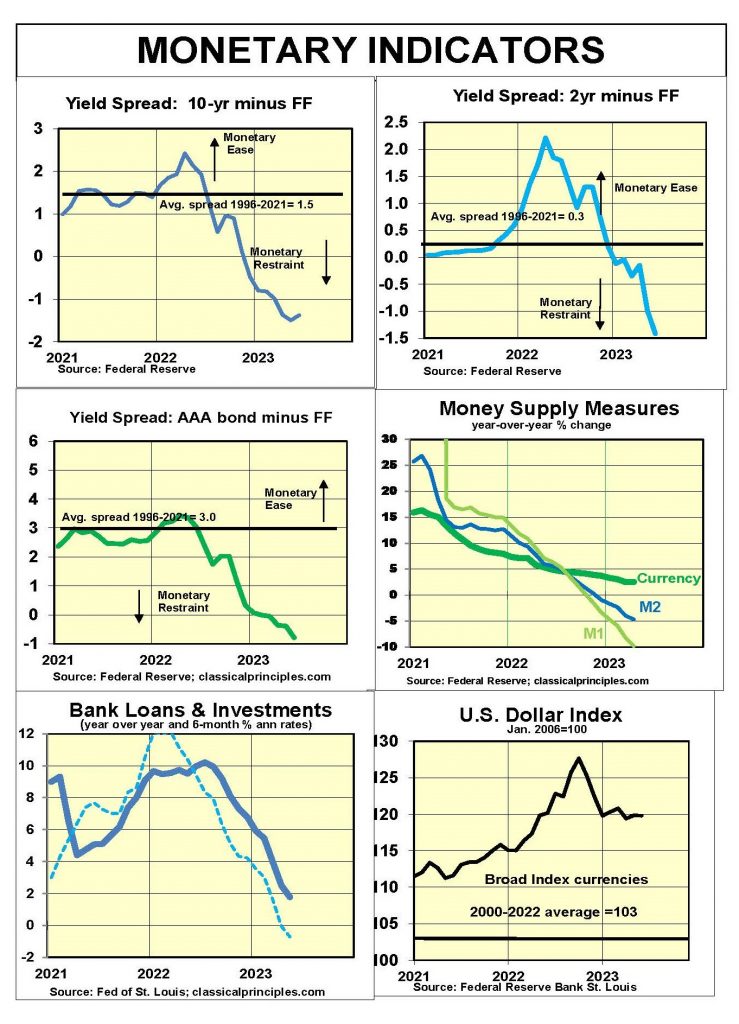
By the end of 2022, yield curves turned inverted and conventional measures turned sharply lower (see charts below).
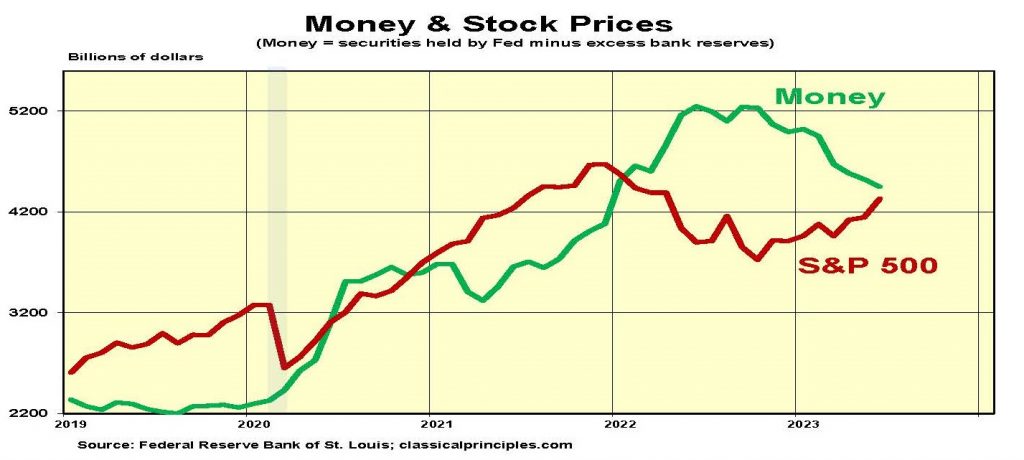
While the behavior in fixed-income markets has been normal, the behavior of the stock market has been abnormal. The chart below shows the stock market began declining six months prior to the leveling off in the money supply. Stocks appear to have anticipated the Fed’s shift to restraint.
This year, amid a steeper decline in the money supply, stock prices are up sharply. The increase in stock prices amid a more restrictive policy is highly abnormal.
History suggests investors should focus more on the money supply than on interest rates. If the Fed continues to sell securities and the money supply continues to decline, stocks are vulnerable. They seldom do well when the Fed is taking money out of the economy.
Just as fixed-income markets recently adjusted their expectations for a quick decline in interest rates, stock investors should be prepared for a similar change in expectations.
Sensitive Indicators
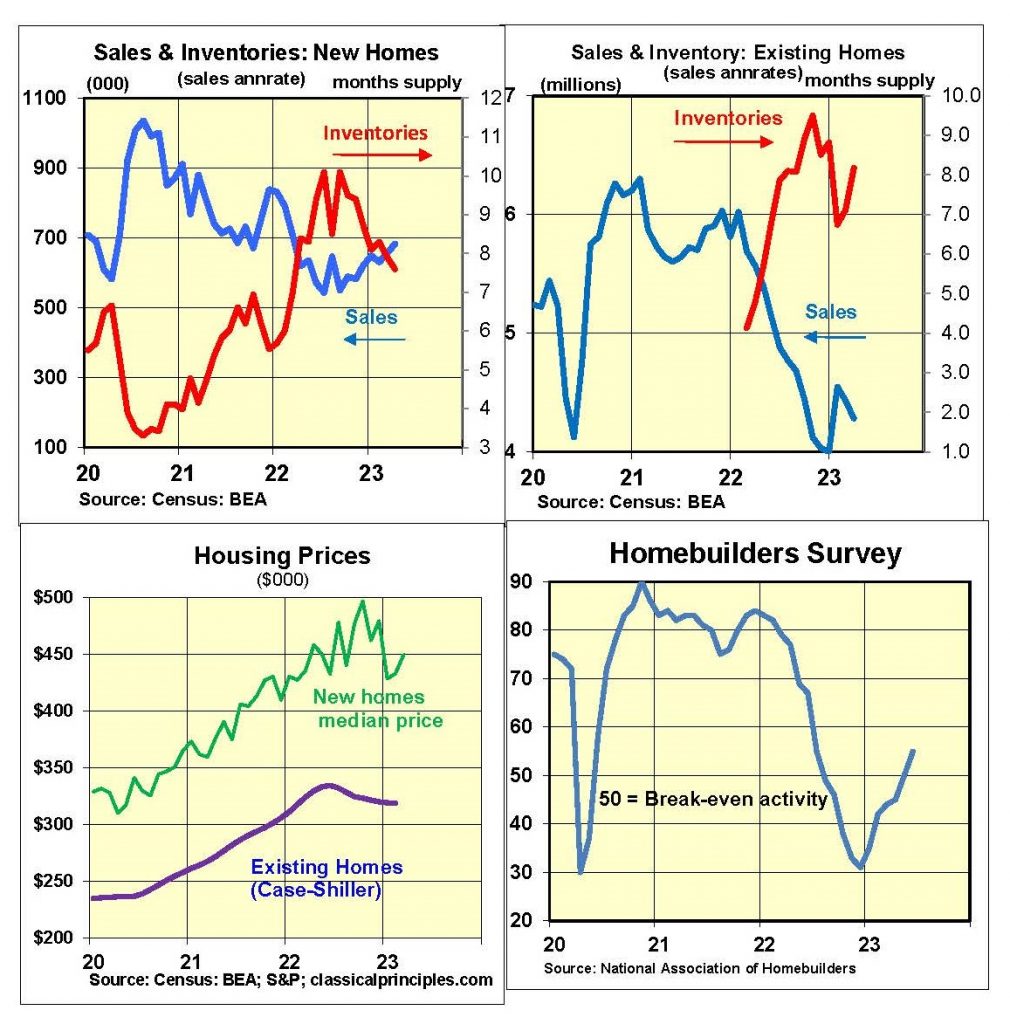
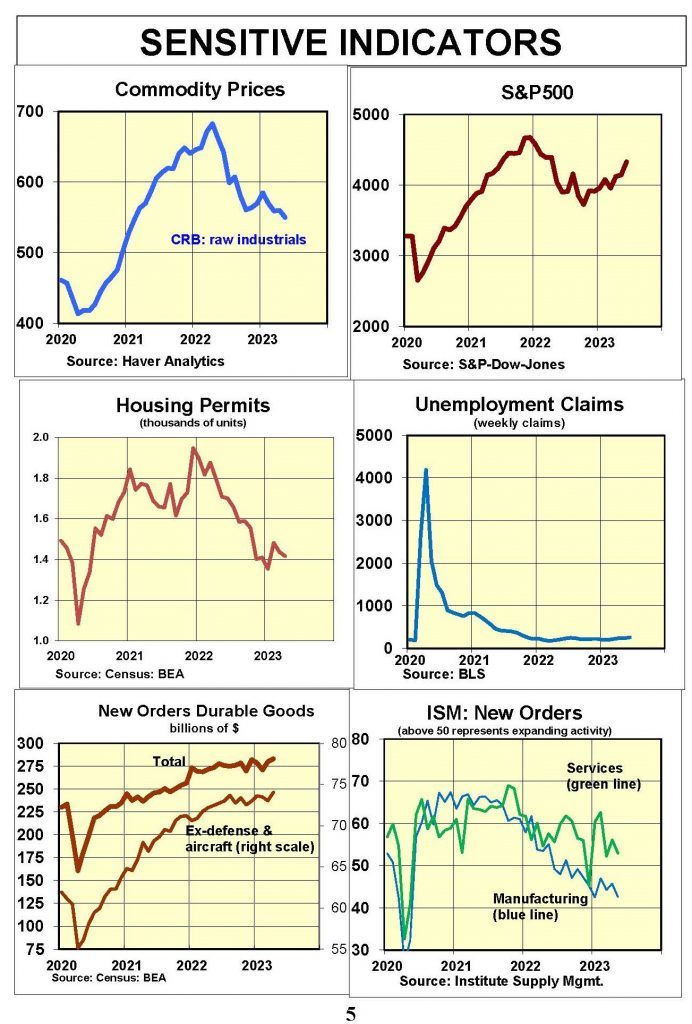
Sensitive indicators are mixed. Commodity prices and surveys point to continued weakness in manufacturing. In contrast, both an upward movement in stocks and the rise in confidence for housing activity point to continued growth.
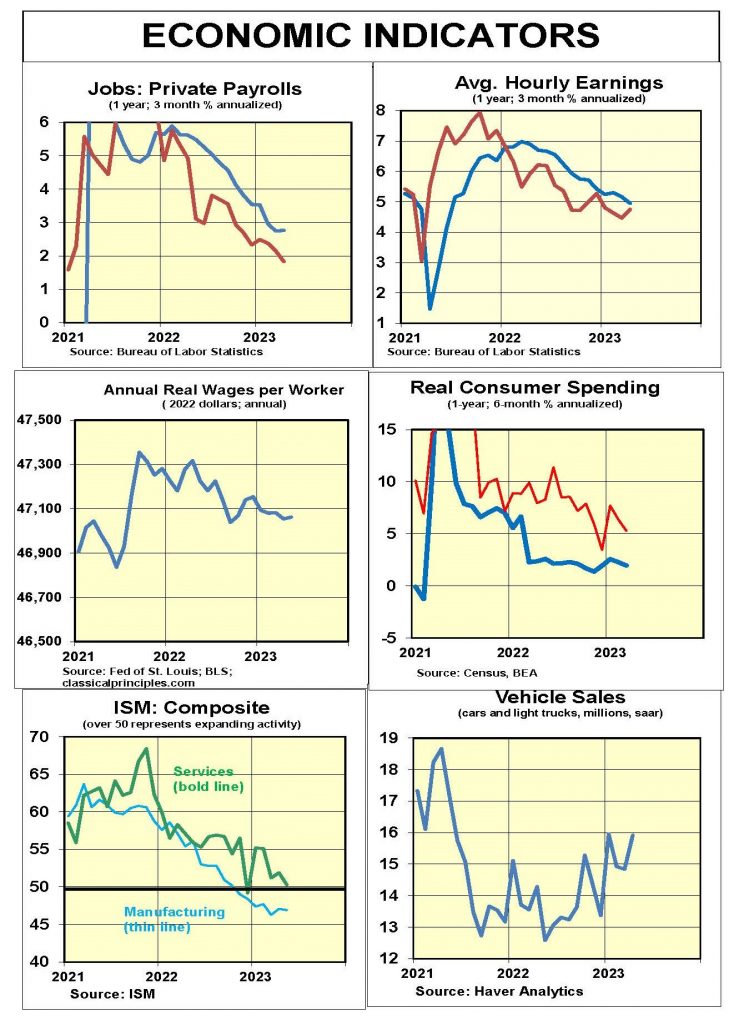
Coincident indicators also are mixed. Employment data show the economy slowing, yet job growth continues. The May ISM surveys hint at some weakness in both manufacturing and service companies. Even so, most data show the economy continues to grow.
Inflation Indicators
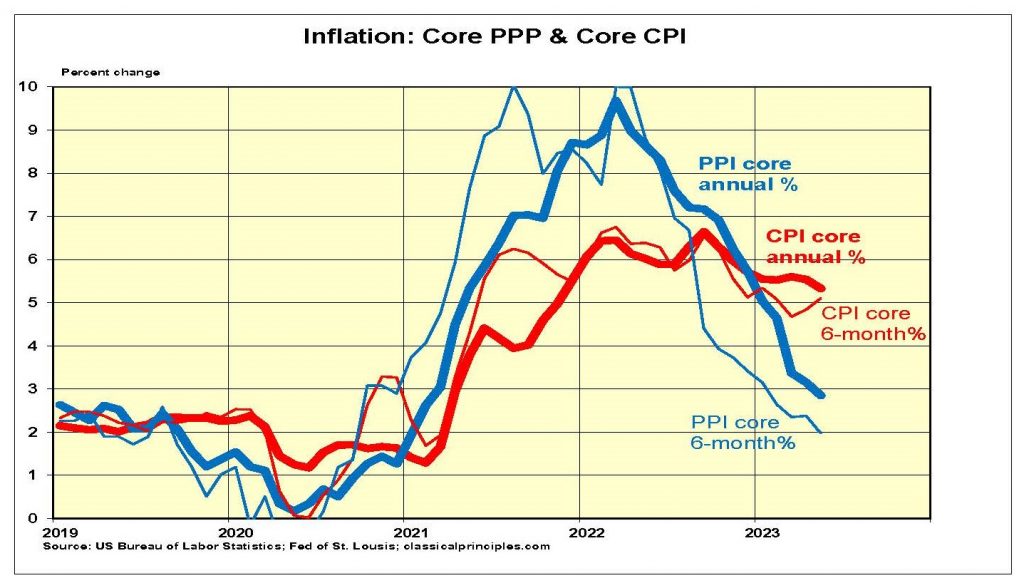
Recent data suggest inflation is slowing, particularly at the producer level. We have found the six-month average of core inflation (ex-food and energy) provides the most reliable early guide to any change in inflationary pressures.
The chart below shows both the annual (bold lines) and the six-month rates of change (thin lines) for the core consumer price index (CPI) and the core producer price index (PPI).
The year-over-year core CPI has fallen only slightly, from 6½ percent to 5½ percent. From this perspective, there has been no significant decline in inflation.
The only good news on inflation is from the core producer price index, which tends to lead the core CPI. The core PPI has fallen to 3 percent over the past year. Even more encouraging, the six-month core PPI rate is down to 2 percent.
While inflation data show progress in moving toward the Fed’s target, there is still a long way to go. Consumer inflation will continue to decline. However, with wage increases still in the 4 percent to 5 percent vicinity, the downturn in consumer prices is unlikely to decline quickly enough for the Fed to end its period of monetary restraint.

Interest Rates
Following the Fed’s mid-2022 shift to monetary restraint, Fed policy has become even more restrictive. Both the money supply and yield spreads point to a likely economic downturn. As a result, we are likely close the peak in short- term interest rates. Our forecast assumes the Fed will keep the fed funds rate near its current level through 2023.
Although it is possible for inflation to decline more rapidly, we doubt it will be soon enough for the Fed to begin easing monetary policy any time this year. Look for both short- and longer-term interest rates to stay higher for longer than financial markets currently expect.
Stock Prices
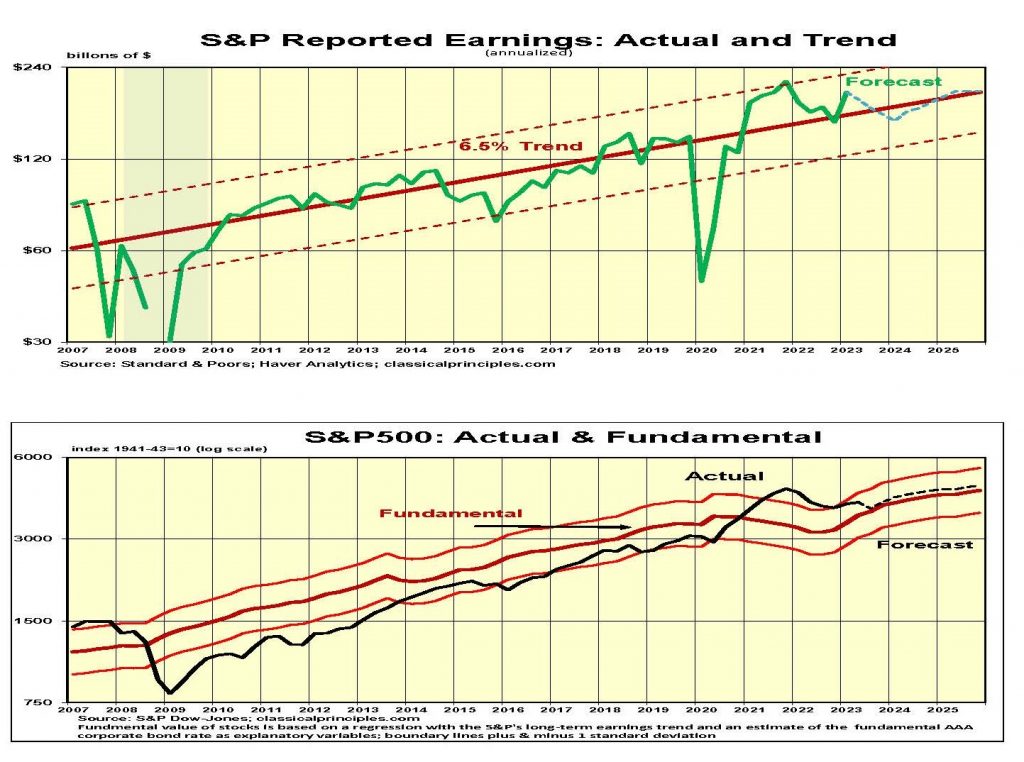
Although the S&P500 is down 9 percent from its high at the beginning of 2022, it is up 22 percent from its October low. The surge in first quarter earnings shown in the chart below has earnings 22 percent above their longer-term trend.
Our estimate of the fundamental value of the S&P500 uses the longer-term earnings trend as our input for profits. It then uses the level of longer-term interest rates to discount earnings based on those interest rates.
With Moody’s AAA bond at 4¾ percent, the fundamental second quarter value of the S&P500 was 3,825. If longer-term rates remain unchanged, the increase in the long-term earnings trend will raise the 3rd quarter fundamental value of the S&P to 3,900. However, if the AAA rate moves to 5.0 percent (as in our forecast), the 3rd quarter fundamental value declines to 3,825. This shows how the value of stocks is highly sensitive to interest rates.
Although we don’t use current earnings in our model, we use earnings relative to its trend as a guide for direction. For the first quarter, reported earnings were $194 annualized. This places them 20 percent above trend.
We expect some disappointing earnings for the current quarter due to higher interest rates and a slowing demand. We also are looking at Treasury receipts for April and May, which are down 24 percent from a year ago. While tax receipt data are highly erratic, the magnitude of the decline points to a potential problem. We remain cautious over the outlook for stocks.
For more great content from Budget & Tax News.
For more from The Heartland Institute.


")

