


YOU SHOULD SUBSCRIBE TO CLIMATE CHANGE WEEKLY.
IN THIS ISSUE:
- Hot Summer Due to Many Factors—Carbon Dioxide Emissions Are Not One of Them
- Podcast of the Week: Climate Uncertainty and Risk: Rethinking Our Response: (Guest: Judith Curry, Ph.D.)
- Large Increase in Atmospheric Water Vapor Likely Contributing to Current Heat Waves
- Solar Panels Production Emits More Carbon Dioxide Than the IPCC Admits
- Video of the Week: Climate Lockdowns: The British Change Their Stance
- BONUS Video of the Week: The Era of Global Boiling Has Begun!? That Sounds Serious
- Climate Comedy
- Recommended Sites
Miss Anything at Heartland’s Climate Conference? No Problem.

Hot Summer Due to Many Factors—Carbon Dioxide Emissions Are Not One of Them

Let’s state the obvious and get it out of the way. It’s hot out there. Yeah, it’s summer and summer is typically hot, but it has as a matter of fact been “hotter than [usual in] July” (hat tip to Stevie Wonder) across much of the globe.
Hundreds, if not thousands, of daily temperature records in cities and towns around the world have been set during the present heatwaves, which, in some locations, have persisted for an extended period. The heatwaves are real. I say heatwaves because it is not a single global event but a series of regional ones.
Why now? For many progressive, bloviating politicians and alarmed reporters in mainstream media the answer is simple: climate change. In the immortal and insightful words of H. L. Mencken, “For every complex problem there is an answer that is clear, simple, and wrong.”
Climate change is a complex, long-term phenomenon, driven by a combination of numerous factors at different locations during different time periods. We can debate the causes of the modest warming of the past 150 to 170 years until we are blue in the face: the extent to which human greenhouse gas emissions contribute to it; the extent to which present measured temperatures are an artifact, at least in part, of the urban heat island effect—as was recently revealed in Houston and Phoenix; deforestation; solar activity; large ocean circulation patterns; and so forth. But the truth is, a recently warming world serves as a backdrop or baseline for the recent heatwaves; it is not their cause. The question is, what accounts for the large temperature spikes this summer—which are widespread, but not universal?
It turns out a confluence of overlapping weather and meteorological events, some having global or hemispheric effects, some more localized, occurring simultaneously, account for the ongoing heatwaves (a series of similar but disconnected heatwaves, which the media has misleadingly treated as a single related event) this summer.
One event that is contributing to a global rise in temperatures this year, and likely will for the next few years, is the Hunga Tonga-Hunga Haʻapai volcanic eruption, described in more detail below. Water vapor makes up the vast majority of the greenhouse gases in the atmosphere, 98 percent or more, and the subsea Hunga Tonga-Hunga Haʻapai eruption added an additional 10 percent to 13 percent to atmospheric water vapor. Scientists from NASA and the European Space Agency agree this huge addition to the dominant atmospheric greenhouse gas is contributing significantly to this years’ temperatures.
In addition, El Niño is back, and it’s a strong one. Before the U.S. summer heatwave struck and the ever climate-obsessed mainstream media focused on climate change as the reason behind it to the exclusion of almost every other factor, the media was warning that with the shift from La Niña to El Niño hotter temperatures would result. Commenting on the role El Niño is playing in the present warming, Michael Wysession, Ph.D., of Washington University in St. Louis, writes at The Conversation:
El Niño is a climate phenomenon that occurs every few years when surface water in the tropical Pacific reverses direction and heats up. That warms the atmosphere above, which influences temperatures and weather patterns around the globe.
Essentially, the atmosphere borrows heat out of the Pacific, and global temperatures increase slightly. This happened in 2016, the time of the last strong El Niño. Global temperatures increased by about 0.25 F (0.14 C) on average, making 2016 the warmest year on record. A weak El Niño also occurred in 2019-2020, contributing to 2020 becoming the world’s second-warmest year.
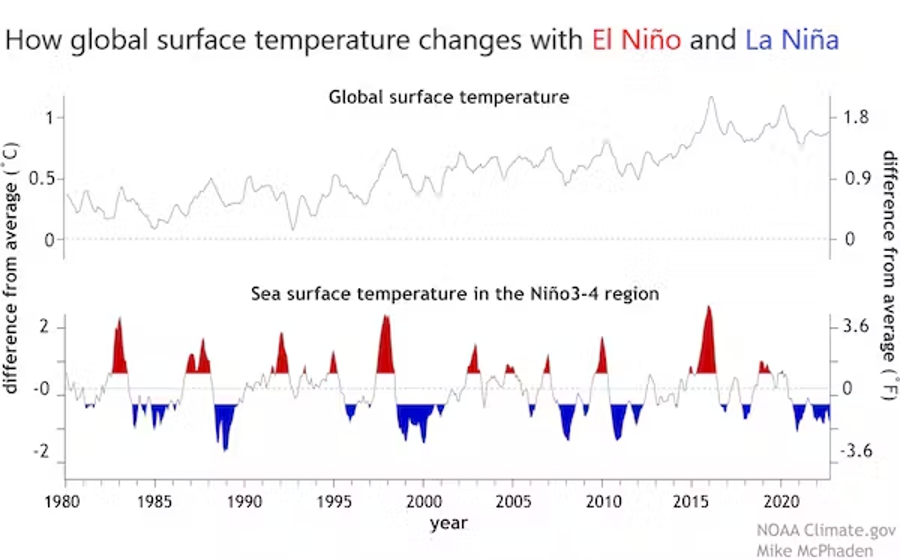
Heartland and other groups held a press briefing in early July, when the El Niño was officially declared, warning that as summer heated up, the mainstream media would largely begin to ignore El Niño’s role in present temperatures, focusing instead on climate change. Our concerns proved prescient. As heatwaves began setting local records, discussions of El Niño’s role disappeared, and climate change claimed the headlines. The media was right in the spring, they are wrong now. El Niño, a cyclical event, is contributing to this year’s hot summer. By contrast, there is no evidence climate change is more than a baseline against which the current spike in temperatures is occurring.
One little-discussed factor affecting this summer’s temperatures is the increasingly active sun. After a period of relative quiescence with little solar activity, the sun has become active again. An active sun has a direct, if modest, effect on the Earth’s temperatures. Some scientists also claim it has larger indirect effects because of its impact on cosmic rays, but that’s a discussion for another time. The point is, Sol’s recent increase in activity is contributing to this summer’s heatwaves.
Regionally, a variety of entirely natural weather patterns have also contributed to warming, and even below normal temperatures in some areas.
Across parts of the western and southeastern United States, and in southern and central Europe, heat domes or “blocking patterns” formed and persisted. As CNN described the situation, “[an] enormous, relentless stubborn ridge of high pressure has trapped air inside in a ‘heat dome’ resulting in extreme temperatures as the dome parks itself over areas.”
The blocking patterns in Europe trapped a heat dome there as it did in the western U.S. In addition, in early July the jet stream shifted. These two meteorological events combined to deliver colder-than-average, even fall-like temperatures in northern Europe and across the United Kingdom, in July and into August, while locking-in, for an extended period of time, extreme summer temperatures in a large swath of southern European nations abutting or near the Mediterranean Sea.
Yet one more factor contributing to hotter than average temperatures over much of the globe this summer are changes in the ocean circulation patterns in the North Atlantic. In a complex story explained by Judith Curry, Ph.D., and Jim Johnstone, it seems that sea surface temperatures in the North Atlantic are unusually high this summer, due largely to a period of rapid warming that began around March-April. That period of warming was brought about by significant changes in the North Atlantic Oscillation and weak surface winds, limiting ocean currents and surface mixing. The resulting increase in Atlantic Ocean temperatures has been hyped in the media, but, of course, wrongly linked to long-term climate change rather than weather anomalies of the type that naturally occur every so often.
In short, there is a complex explanation for the complex weather patterns that have prevailed this summer. Multiple geologic, solar, meteorological, and atmospheric events have occurred simultaneously, resulting in unusually high summer temperatures obtaining over much of the world. Fossil fuel use does not cause volcanic eruptions, oceanic and wind current shifts, or changes in solar activity, thus climate change cannot fairly be blamed for the present pattern of heatwaves, which long-term data show have not increased.
Source: NPR; The Conversation; CNN; Climate Etc.; The Daily Mail; Climate Realism
Get your Copy at Amazon TODAY!

Podcast of the Week
In her book, Climate Uncertainty and Risk, Dr. Judith Curry describes how the climate science community has been captured by certain points of view concerning society and the desire for consensus, undermining its pursuit of objective facts. Climate change claims are fraught with uncertainty, only to be shrouded in secrecy for those who seek real-world data. The result is a society that bases it’s policy decisions of improper, and often incorrect, scientific assertions, rather than advancing human wellbeing.
Subscribe to the Environment & Climate News podcast on Apple Podcasts, iHeart, Spotify or wherever you get your podcasts. And be sure to leave a positive review!
Large Increase in Atmospheric Water Vapor Likely Contributing to Current Heat Wave

Evidence suggests one factor contributing to the above average heat many parts of the globe are experiencing this summer is the undersea eruption of the Hunga Tonga-Hunga Haʻapai volcano.
Both NASA and the European Space Agency are reporting that the eruption ejected enough water into the atmosphere to temporarily raise the Earth’s temperature.
Peer reviewed studies have estimated that Hunga Tonga-Hunga Haʻapai’s eruption added the equivalent of 10 percent to 13 percent of the pre-existing water vapor into the upper atmosphere, between 8 and 33 miles above the Earth’s surface where it will remain for years to come.
Although little acknowledged or discussed, water vapor rather than carbon dioxide makes up as much as 98 percent or more of the greenhouse gases in the atmosphere by volume. As such, adding an additional 10 to 13 percent to the atmospheric load of water vapor in the short three months studies estimate it took to disperse and mix across the globe is bound to have a significant effect on measured temperatures, which recent studies have acknowledged.
Concerning the impact of Hunga Tonga-Hunga Haʻapai’s eruption researchers at NASA’s Jet Propulsion Laboratory wrote:
Volcanic eruptions rarely inject much water into the stratosphere. In the 18 years that NASA has been taking measurements, only two other eruptions—the 2008 Kasatochi event in Alaska and the 2015 Calbuco eruption in Chile—sent appreciable amounts of water vapor to such high altitudes. But those were mere blips compared to the Tonga event, and the water vapor from both previous eruptions dissipated quickly. The excess water vapor injected by the Tonga volcano, on the other hand, could remain in the stratosphere for several years.
This extra water vapor could influence atmospheric chemistry, boosting certain chemical reactions that could temporarily worsen depletion of the ozone layer. It could also influence surface temperatures. Massive volcanic eruptions like Krakatoa and Mount Pinatubo typically cool Earth’s surface by ejecting gases, dust, and ash that reflect sunlight back into space. In contrast, the Tonga volcano didn’t inject large amounts of aerosols into the stratosphere, and the huge amounts of water vapor from the eruption may have a small, temporary warming effect, since water vapor traps heat.
When was the last time, amidst the thousands of stories blaming climate change for the current heatwave, you saw a headline in the mainstream media, “Volcanic Eruption Causes Summer Heatwave”? I’ve seen not one.
Sources: Climate Realism; American Thinker
Heartland’s Must-read Climate Sites


Solar Panel Production Emits More Carbon Dioxide Than the IPCC Admits

Recently, researchers have tried to calculate the cradle-to-grave carbon dioxide emissions from the global solar energy push. So far, such analyses have found the solar industry has a much higher carbon footprint than previously claimed. As a result, government policies incentivizing and mandating the use of solar energy undercount carbon dioxide emissions from solar panel production by 300 percent or more. A report by the group Environmental Progress sums up the problem of solar energy’s green bona fides, writing:
Information unearthed by Environmental Progress points to a gaping oversight in how the figures influencing government net zero policy and investments in solar worldwide are compiled and collated …
Key to this blind spot is that the source material for most of the assessments is provided by a small number of data compilers, many if not all of them working in collaboration with the International Energy Agency (IEA). The data is voluntarily submitted by the industry in response to academic surveys.
… This data is relied on by institutions worldwide, including the IPCC [Intergovernmental Panel on Climate Change] and IEA itself, to calculate their carbon footprint projections, including the sixth assessment report published as recently as March 2023.
Based on such data, the IPCC claims solar PV is 48 gCO2/kWh. But, … a new investigation started by Italian researcher, Enrico Mariutti, suggests that the number is closer to between 170 and 250 gCO2/kWh, depending on the energy mix used to power PV production. If this estimate is accurate, solar would not compare favorably with natural gas, …
Due to low energy costs when compared to Europe, the United States, and elsewhere (due to the vast majority of the electricity being generated by coal), heavy government support, and cheap labor, most of the world’s solar silicon wafer production moved from Europe, the United States, and Japan in less than a decade as industrialized economies began to increasingly mandate solar energy to reduce carbon dioxide emissions. China proved more than happy to feed their solar addiction.
The problem is that China’s emission reporting is opaque. As such, instead of using real world data on emissions as they are actually produced in China, the data used by the IEA and the IPCC to calculate the carbon dioxide emissions from solar panel production is based on modeled emissions from Europe and the United States from when they dominated solar panel production—yet they get their energy from sources that emit much less CO2 per unit of energy than does China. The discrepancy is huge. And this calculation doesn’t even include the emissions from mining, installing, operating or disposing of solar panels.
The IEA projects that China will continue to dominate solar panel and solar panel component production well into the future. How dominant is China now, one might ask? Environmental Progress provides an answer:
[I]n 2021 China produced more than 80 percent of global solar-grade polysilicon, a critical input into solar arrays. It doesn’t stop there; China manufactures 97 percent of the global supply of solar wafers, another essential component.
… Until the mid-2000s the market was dominated by Japanese, US and German manufacturers, many of whom were in the midst of automating their production lines, when Chinese manufacturers swooped in to take their market share. The disruption happened in under a decade, with China’s global share of PV production surging from 14 percent in 2006 to 60 percent by 2013.
The coal-fueled electricity used in a single one of China’s polysilicon wafer production regions alone is more than double the electricity from all sources used for such production in the Germany, Japan, and the United States combined.
Environmental Progress used Mariutti’s math to calculate how badly the EU underestimated the emissions from the solar installations brought online in Europe in 2022 alone. The undercount was “5.4 to 7.6 million metric tons, equivalent to adding 3.4 to 4.8 million cars to the road.”
According to Cowboy State Daily, Travis Deti, executive director of the Wyoming Mining Association, was not surprised by Mariutti’s and Environmental Progress’ findings.
“The dirty little secret with so-called renewable energy—I call it unreliable energy—wind and solar, is that it takes immense amounts of energy to create them,” said Deti. “The hypocrisy of it all is that they [China and other countries] don’t have the environmental standards, the pollution standards and the emission standards of the U.S.
“That’s the dirty little secret with so-called clean energy,” Deti told Cowboy State Daily.
Sources: Environmental Progress; Cowboy State Daily
Video of the Week
In this episode of Climate Change Roundtable, we will head across the pond to the UK to look at the results of a joint poll conducted by YouGov, CAR26, and The Heartland Institute. According to the most recent results, there has been a 20% decrease in the number of Brits who strongly supported the idea of climate lockdowns back in October 2021.
Joining us is special guest Lois Perry of CAR26 to discuss what she observes going on with the climate policies in Britain. We also have our usual fun poking holes in the craziest climate news of the week!
Watch every episode of The Heartland Institute’s Climate Change Roundtable show LIVE every Friday at 1 p.m. ET.
BONUS Video of the Week
Can the climate catastrophists get any crazier? Old and cold: The hottest July in the last 120,000 years. New and hot: The era of global warming has ended, and the era of global boiling has begun.”
Heartland Institute President James Taylor was a guest of the great Tony Katz debunking these ridiculous claims that are causing real mental damage to those who are conditioned to trust their “superiors” in media and in government.
United Nations Secretary General António Guterres recently stated this: “Climate change is here, it is terrifying, and it’s only the beginning. The era of global warming has ended, and the era of global boiling has begun.”
Climate Comedy
 via Cartoons by Josh


")

