
As we head toward the fourth quarter of the year, the economy remains precarious. The decreasing money supply and inverted bond yields are signs of a likely economic downturn.
The money supply (by our measure) is down 16 percent for the year ending in August. However, the prior surge in money was so great that the average growth for the past two-years still is showing an average increase of 8 percent a year.
With this decline in money, the economy and fixed-income markets have responded as expected. Interest rates are up sharply, and sensitive areas of the economy are down sharply.
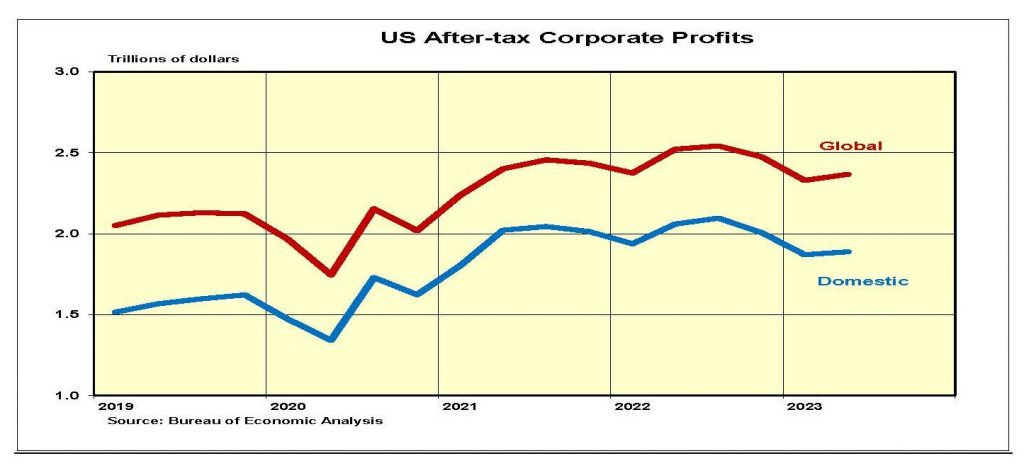
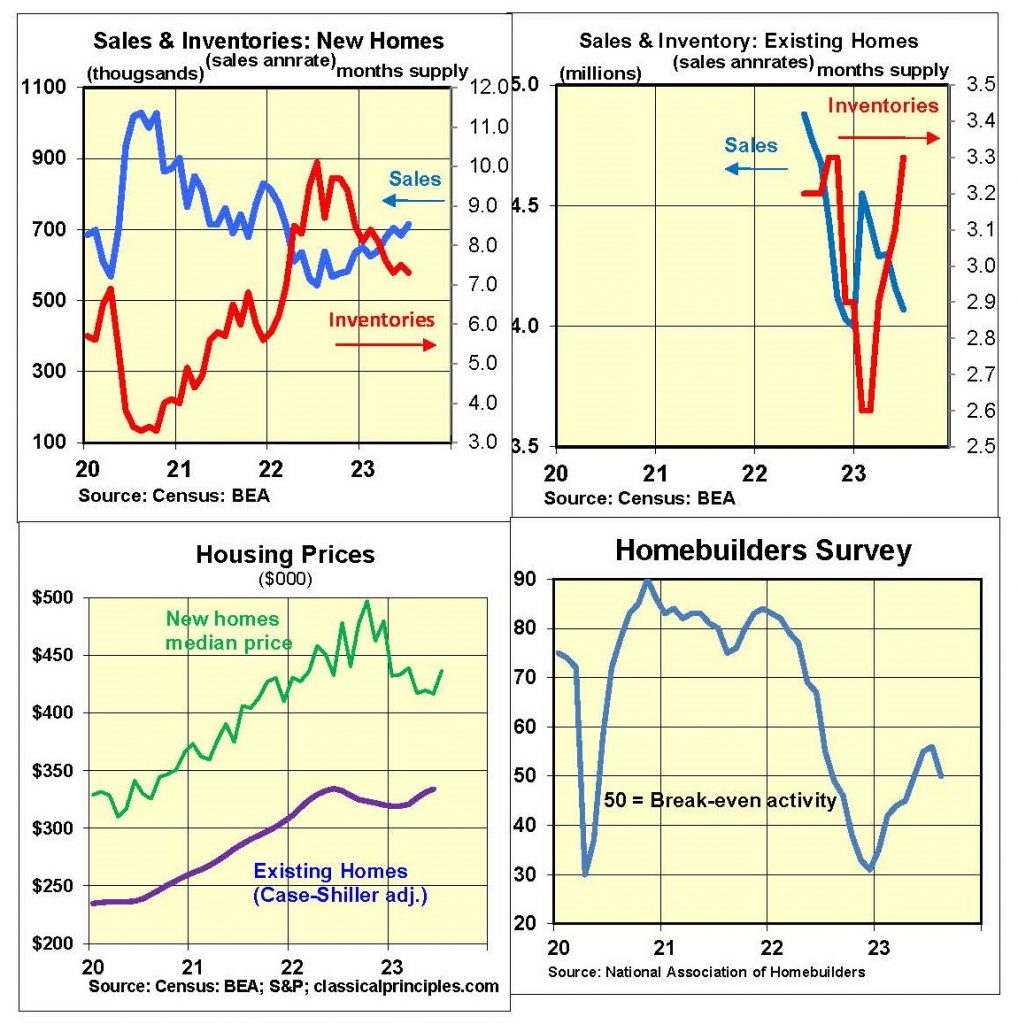
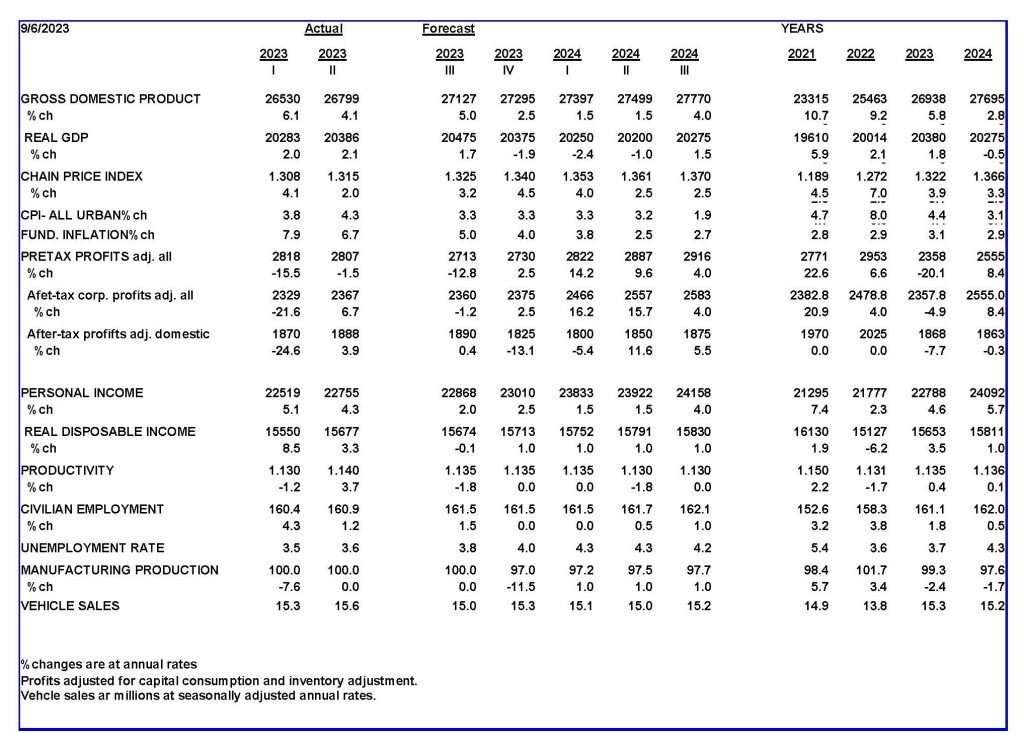
After peaking in the spring of 2022, housing starts and permits are down 20 percent, and existing home sales are down 30 percent. Second quarter U.S. corporate profits were down 10 percent from the third quarter of 2022 from domestic businesses and down 7 percent when profits from foreign operations are included. In contrast, S&P500 profits are up 12 percent over this period (but down 8 percent from their peak in late 2021).
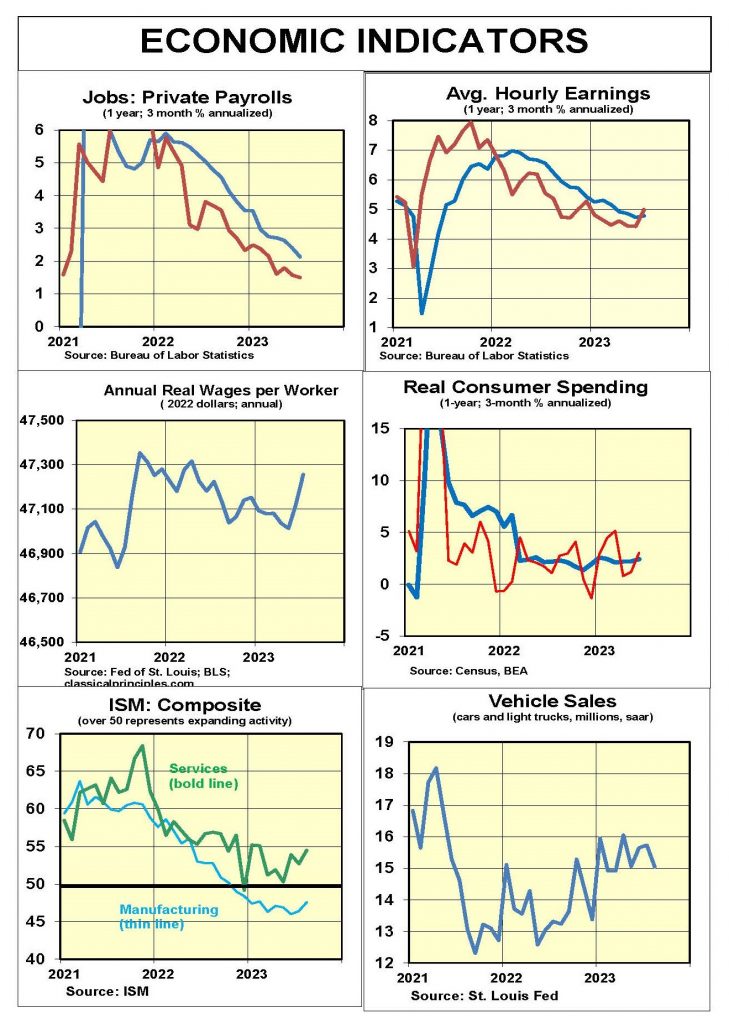
So far, only the initial response to the Fed’s tightening has become apparent. July data were mixed. Consumer spending and wages soared at 7 percent annual rates in the three months ending in July. Over the same period, personal incomes rose at only a 3 percent rate and real disposable income was up at only a 1 percent rate.
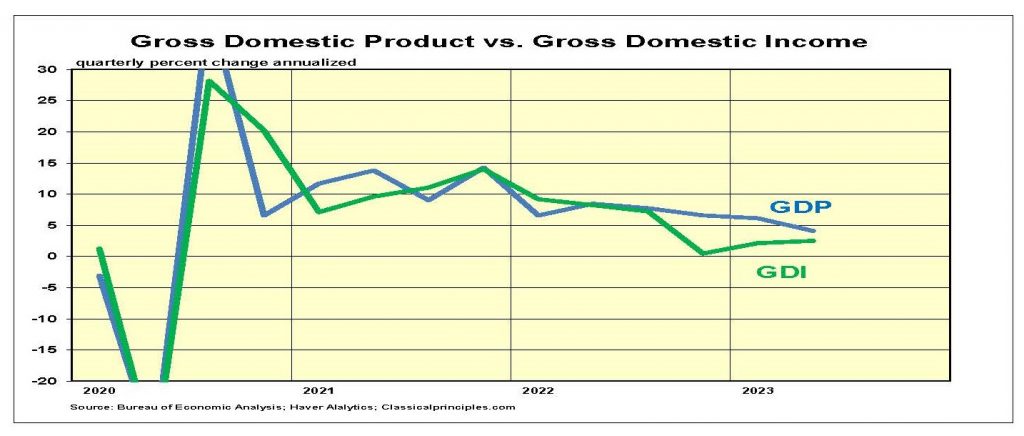
In a case of dueling models, the Fed of Atlanta and Fed of St. Louis estimate third quarter growth at 5.6 percent and 0 percent, respectively. Whatever the real number is, expect both spending and income data to weaken further as the economy downshifts and business activity declines.
Monetary Indicators and the Economy
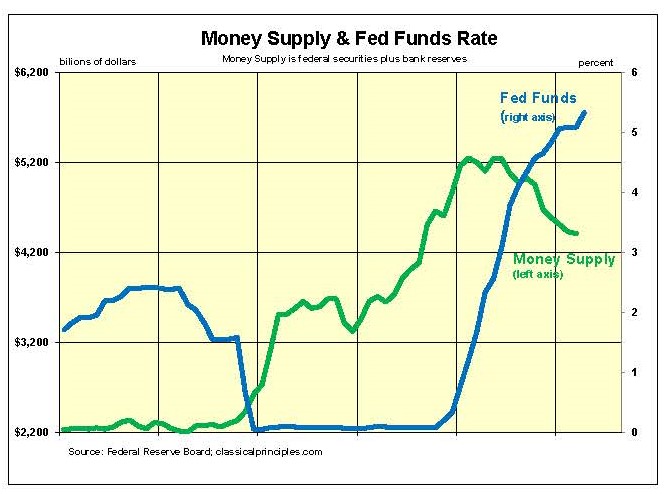
The chart below shows the money supply measured as changes in the Fed’s holdings of securities and shifts in bank deposits with the Fed. If the Fed continues selling securities through November, the yearly change in money will be down 21 percent and the two-year average growth will fall to zero.
Interest rates responded to the erratic shift in money in a normal manner. The leveling off and subsequent decline in the money supply was accompanied by the sharp increase in interest rates.
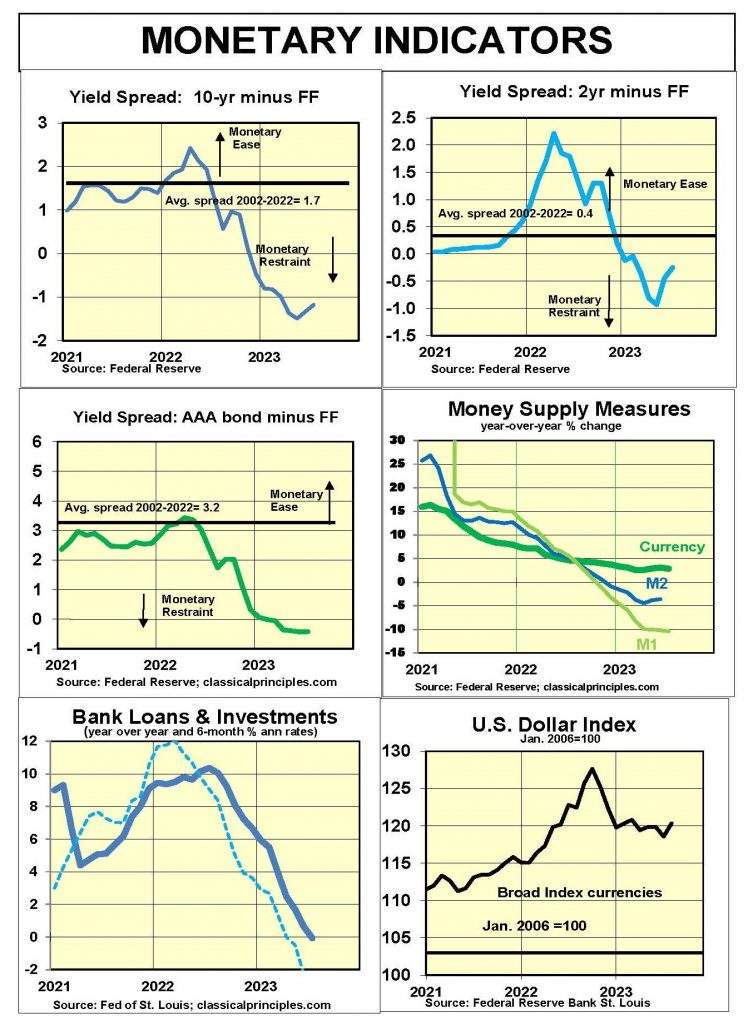
By the end of 2022, yield curves turned inverted and conventional money measures were sharply lower (See charts below.)
Although the behavior in fixed-income markets and in most sensitive indicators has been normal, the behavior of the stock market has been less conventional.
When the Fed sells securities, it tends to reduce the amount of money in circulation. Those who purchase the securities send checks to the Fed for payment. When the Fed cashes the checks, it reduces the public’s checking account deposits. This reduction in the money supply places downward pressure on stock prices, sensitive indicators, and eventually the rest of the economy.
The slowdown in current dollar spending and income shown in the following chart is typical of the normal pattern associated with monetary restraint. The same is true for the overall decline in stock prices.
Despite recent signs of strength in the economy, an increase in business activity would be inconsistent with monetary restraint. Without a shift toward an easier monetary policy, the most likely development is a further weakening in the economy, corporate profits, and stock prices.
Sensitive Indicators
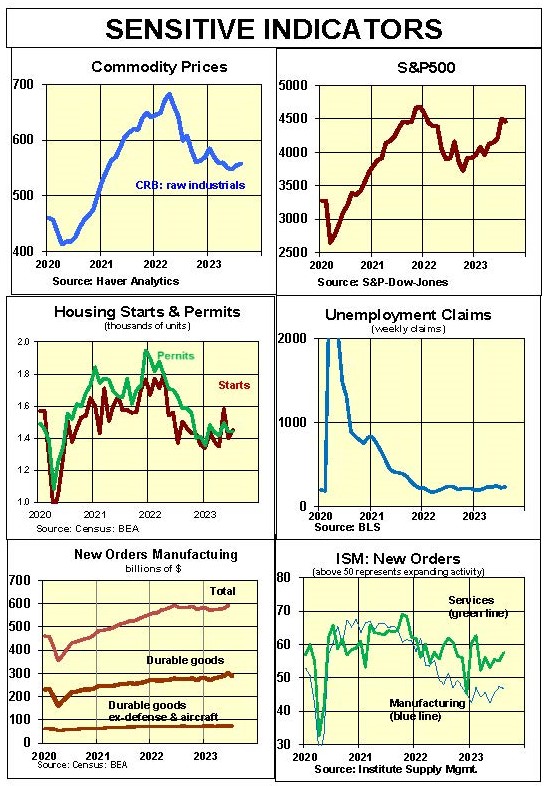
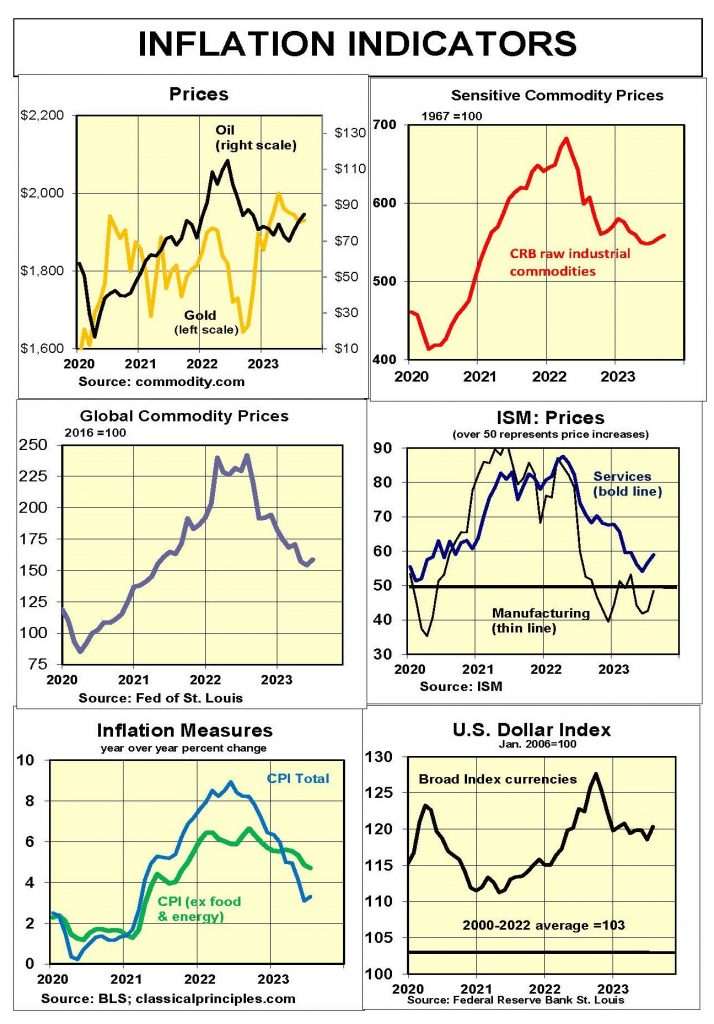
Sensitive indicators are mixed. Since the spring of 2022, housing starts and permits are down 20 percent and existing home sales are down 30 percent. Raw industrial commodity prices similarly are down 16 percent.
In contrast, the 20 percent rise in stock prices since October 2022 has pushed the S&P500 up to only 6 percent below its all-time peak.
Business surveys for August were mixed, The ISM surveys show a strong service sector with higher orders and higher inflation. In contrast, the S&P survey shows the service sector essentially flat. These surveys obviously are talking to different companies.
Coincident indicators also are mixed. Employment data show a slowdown in job growth, but an economy that continues to grow. We expect the Bureau of Economic Analysis to announce downward revisions to both employment and income data later this month.
Inflation Indicators
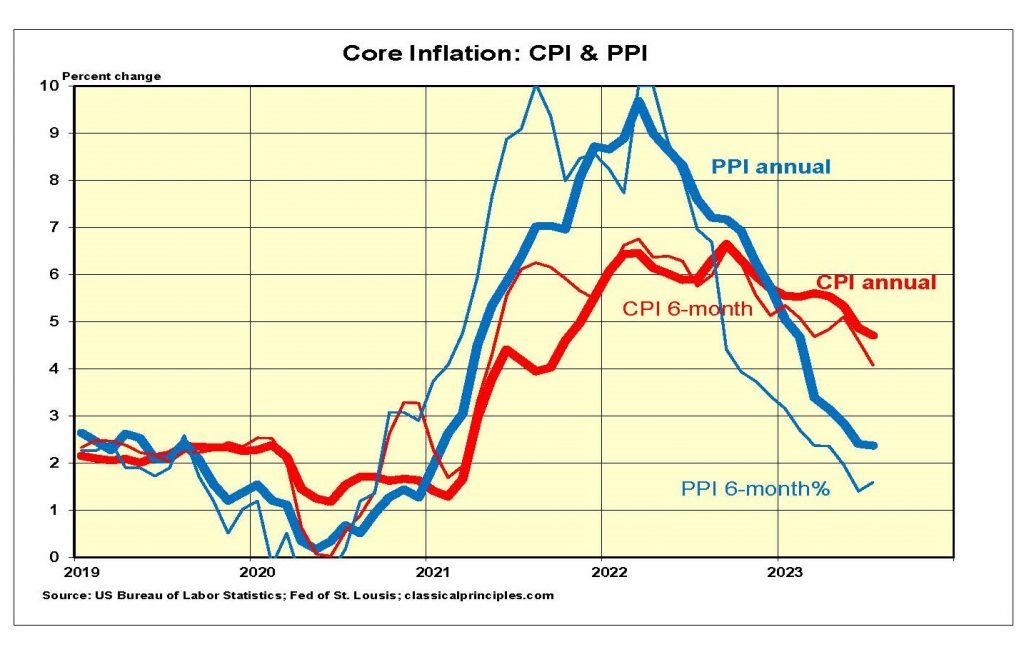
Recent data show inflation is slowing, particularly at the producer level. We have found the six-month average of core inflation (ex-food and energy) provides the most reliable early inflation guide to any change.
The chart below shows both the annual (bold lines) and the six-month rates of change (thin lines) for the core consumer price index (CPI) and the core producer price index (PPI).
Both the year-over-year core CPI and its six-month average have fallen to 4 percent to 5 percent. From this perspective, there has been a moderate decline in inflation.
The good news on inflation is from the core producer price index, which tends to lead the core CPI. The core PPI has fallen to the 2 percent vicinity for both the past year and the past six months.
While these data show progress in moving toward the Fed’s target, there is still a long way to go. With the slowdown in spending and incomes, consumer inflation should continue to decline.
The main opportunity for the core CPI to reach the Fed’s target will occur if the economy enters a downturn at year-end which continues into 2024. The Fed’s policy on ongoing monetary restraint continues to make a downturn in both the economy and inflation the most likely outcome.
Interest Rates
The latest surge in oil prices will make it difficult for the Fed to end its restrictive monetary policy. Although the Fed is widely expected to hold its target rate at 5.3 percent, look for the central bank to continue selling securities. Even if the Fed uses its power to keep interest rates unchanged, selling securities increases monetary restraint.
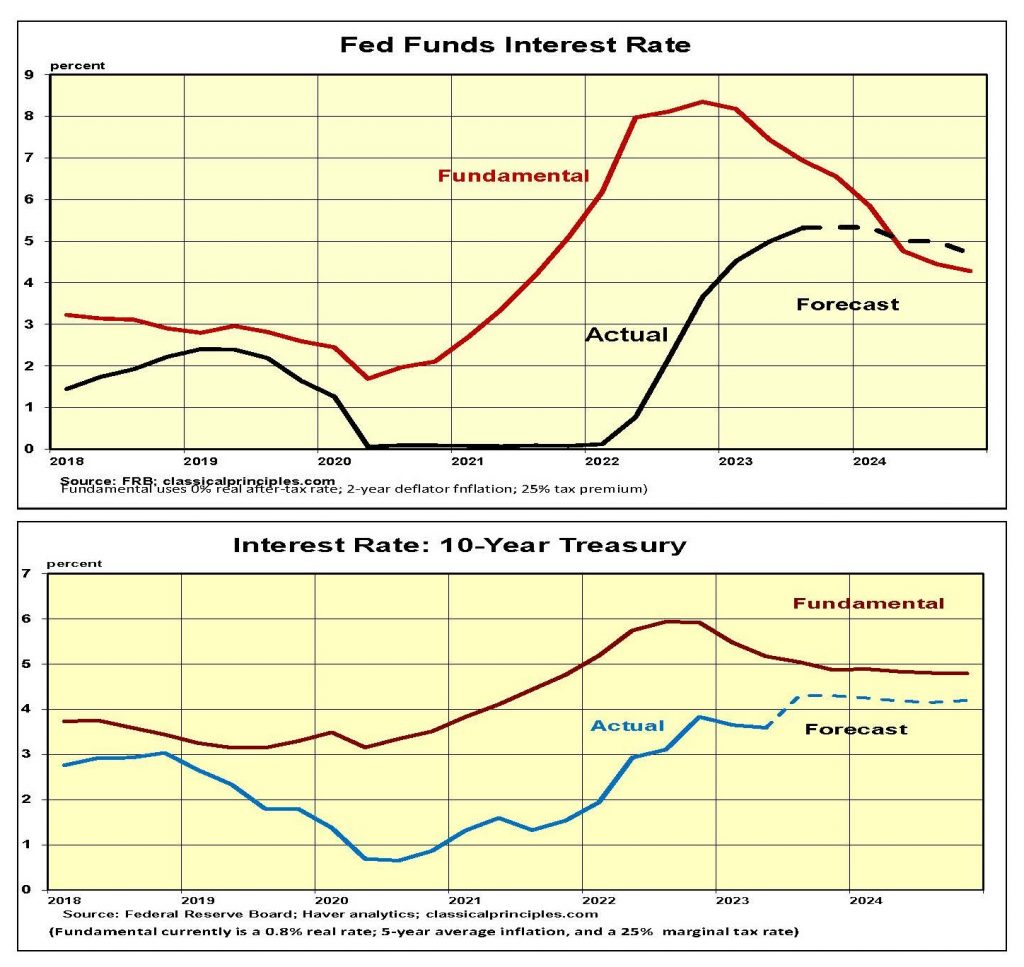
Both the money supply and yield spreads point to a likely economic downturn late this year and into 2024. Once the weakness in the economy becomes apparent, the Fed will no longer raise interest rates.
Our forecast calls for the Fed to keep the fed funds rate close to its current level until the spring of 2024. The expected weakness in the economy and an easing in inflation should then allow the Fed to begin lowering short-term rates.
Stock Prices
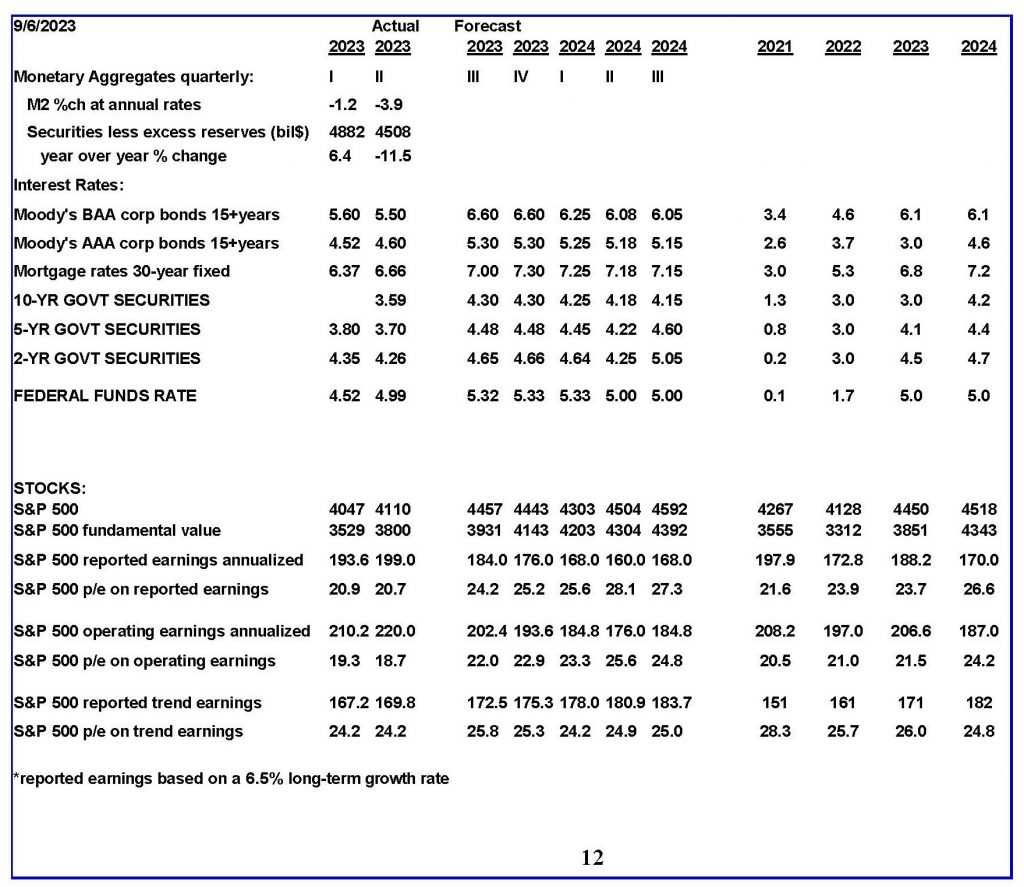
Total U.S. second-quarter profits were down 7 percent to 10 percent from their third-quarter 2022 peak. This represents a normal profit response to monetary restraint. In contrast, second quarter S&P500 earnings are up 4 percent from the third quarter of 2022, an atypical response.
This atypical response puts second quarter S&P500 earnings 8 percent above its longer-term trend. In contrast, second quarter total U.S. corporate profits were 30 percent below their longer-term trend. S&P500 profit numbers appear grossly overstated in comparison to all U.S. company profits.
Our stock market model uses the longer-term trend of S&P500 earnings and adjusts them for interest rates. With the yield on AAA bonds approaching 5 percent, our model estimates the fundamental value of the S&P500 at 3,850. This indicates that the current index is 17 percent overvalued.
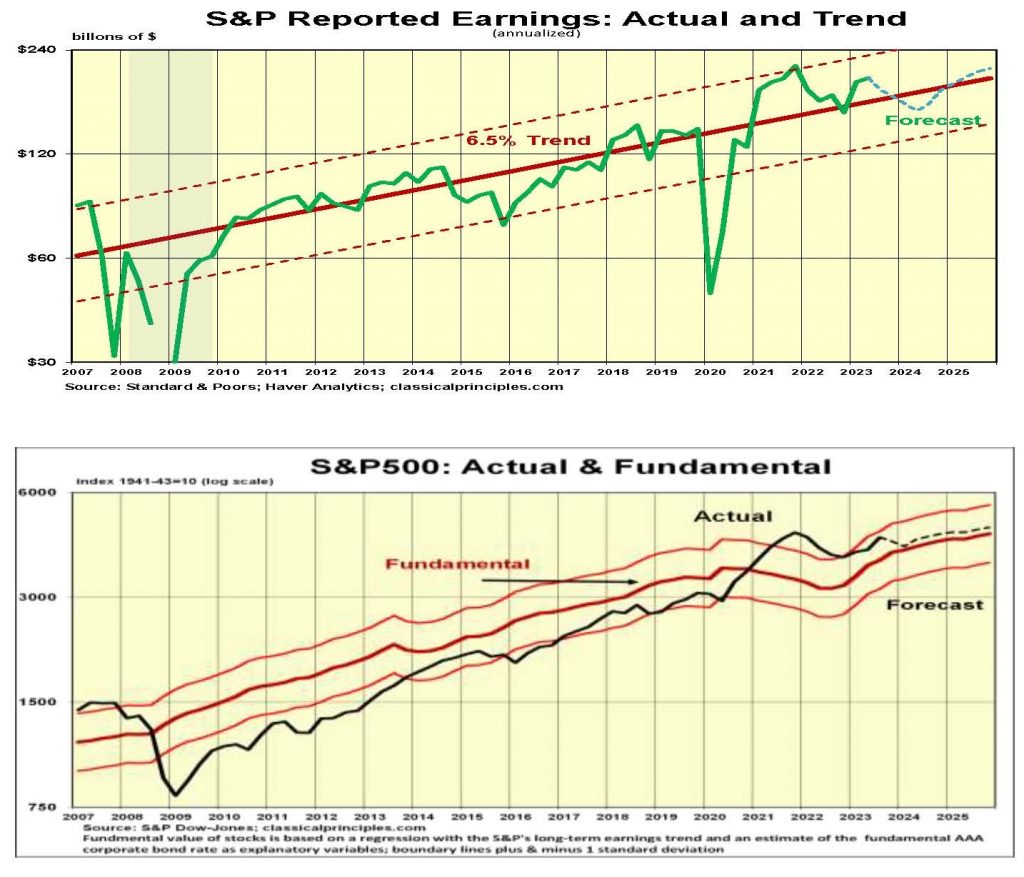
Most analysts are anticipating rising profits this quarter and beyond. In contrast, we believe the weaker economy and higher interest rates will lead to lower profits and downward pressure on stocks.
For more Budget & Tax News.
For more from The Heartland Institute.


")

