


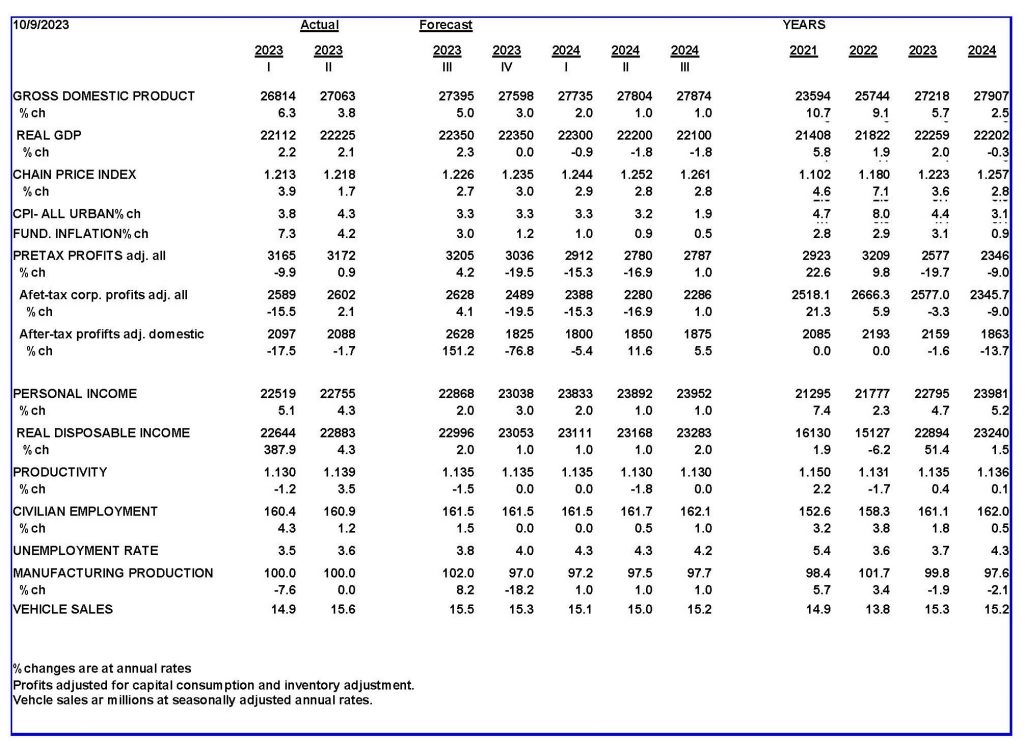
The economic data for the third quarter shows an increase in the risk of inflation caused by the rapid growth of spending.
There are numerous signs the economy is growing too fast to contain inflation. Two models from different Federal Reserve Regional Banks estimate third quarter real growth at 3¾ percent. If so, adding 2 percent for inflation leaves the quarterly spending pace at 5¾ percent. That is too fast to contain inflation.
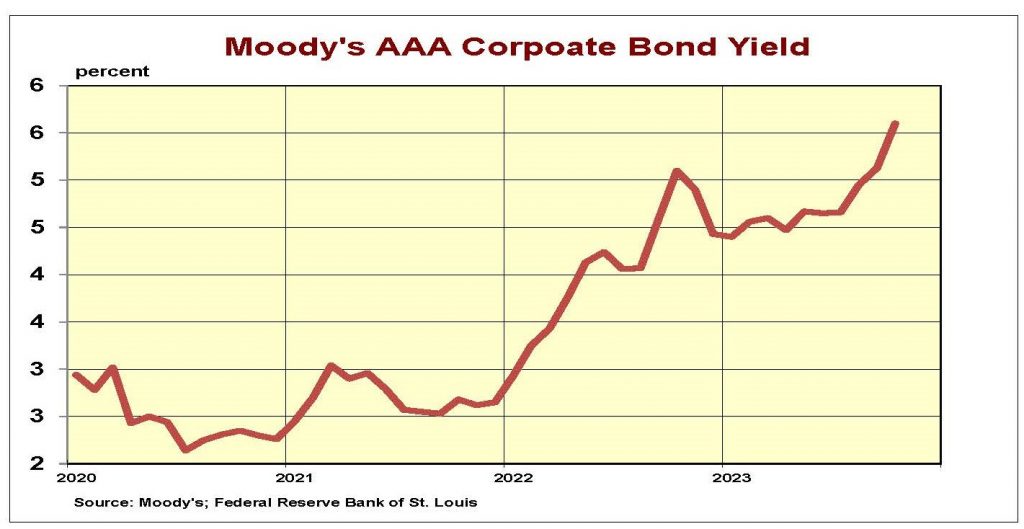
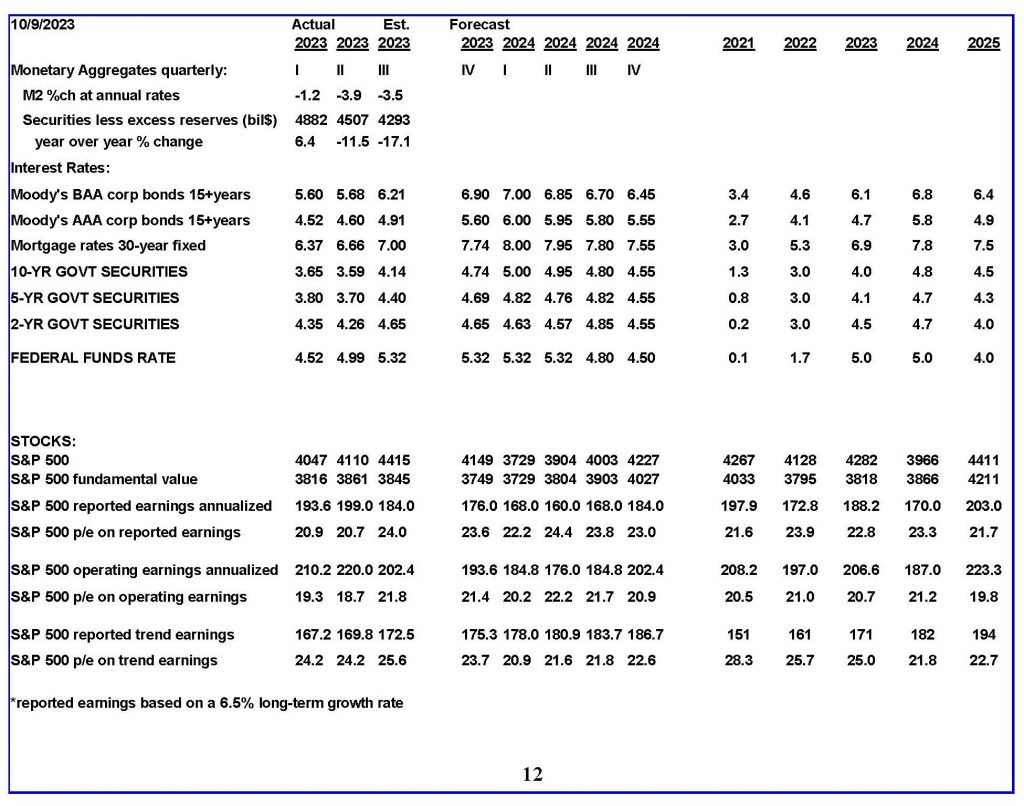
Bondholders reacted to the strong growth by driving the yield on AAA bonds from 4.6 percent three months ago to 5.6 percent now. This one-percentage-point interest rate increase lowers our estimate of the S&P500’s value from 4,000 to 3,750.
Determining the rate at which longer-term interest rates will peak is challenging. One part is determining long-term inflationary expectations.
The second issue is determining the interest rate at which refunding the soaring federal debt crowds out long-term private borrowers.
In this competition for long-term debt, interest rates reflect the price the last private creditor is willing to pay. There is no model that indicates at what point rates are high enough to end the bidding. We have plugged in a peak of 6 percent for the 10-year T-Note in the first quarter, assuming a sufficient decrease in private demand for credit to allow for a peak. Without a good basis for our assumption, we continue to believe both stock and bond markets contain considerable risk.
Monetary Indicators and the Economy
Monetary indicators continue to show a highly restrictive policy. Our preferred money measure shows the money supply in October was down 20 percent from a year ago. The dotted line extending through December assumes the Fed will continue to sell securities. At that time the money supply would be down 22 percent year-over-year.
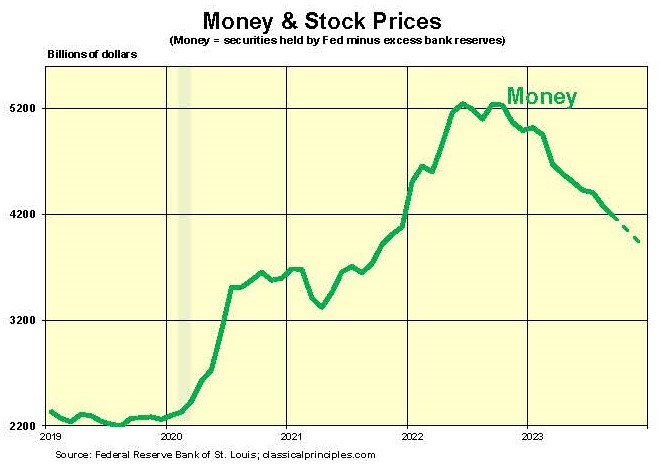
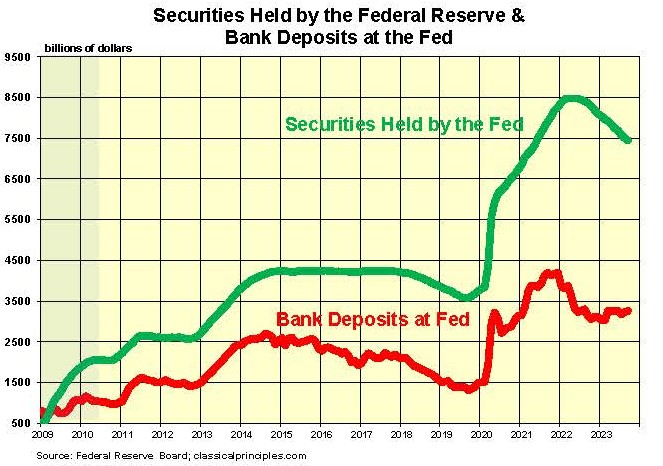
The main component of our money indicator is the Fed’s purchases and sales of securities. The Fed’s security holdings peaked in April, 2022 at $8.5 trillion. Total sales through September of this year were just over $1 trillion.
The second component of our indicator is the change in bank deposits with the Fed. These declined sharply in 2022, offsetting much of the effect of the Fed’s security sales. However, bank deposits this year are slightly higher.
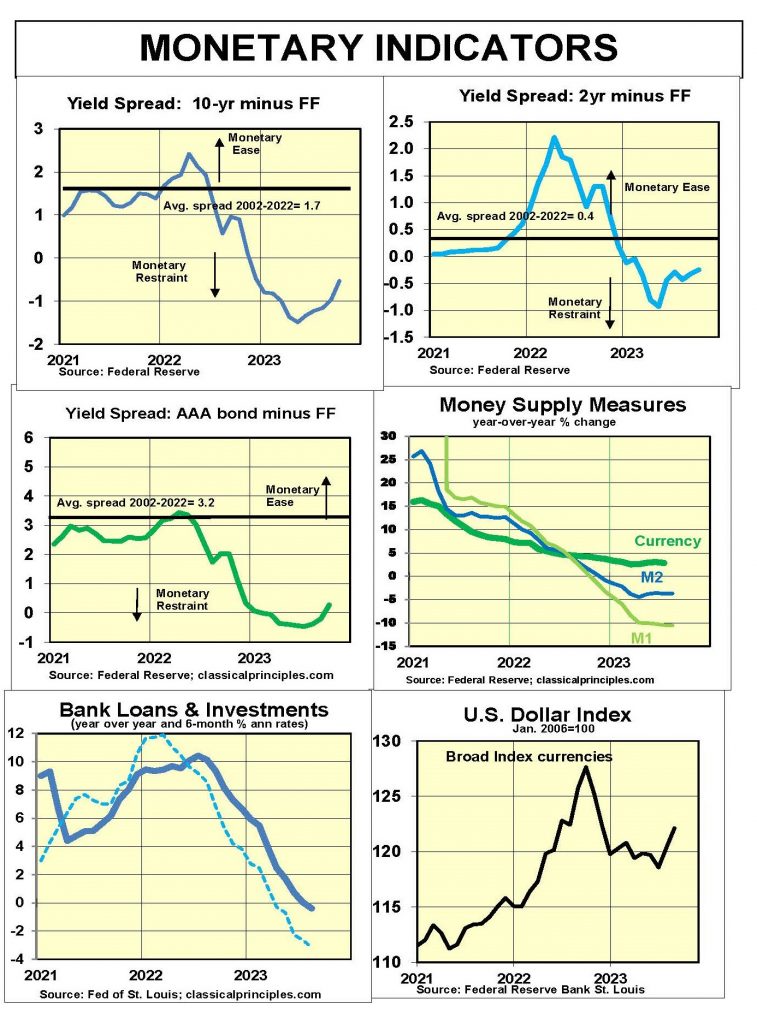
Alternative money measures confirm the restrictive nature of the Fed’s current policy. M1 (currency and demand deposits) and M2 (M1 plus additional deposits) are down 10 percent and 5 percent, respectively, over the past year.
Although many indicators suggest the economy has been growing fast, it is difficult to believe this is actually true. The downward pressure on the economy from limiting the money supply already has slowed key sensitive areas.
History shows monetary restraint consistently leads to declines in economic activity, with a variable lag of six to nine months. Lags can be shorter or longer.
The Fed is aware of these lags. Chairman Jerome Powell talks about them at each meeting. We assume the Fed will decide to hold the funds rate at 5.3 percent while continuing to sell securities. The Fed’s artificial interest rate can impact market psychology, but it is not the prime driver of monetary policy at this point. The key driver is the Fed’s selling of securities.
If our analysis is correct, the Fed’s monetary policy will become progressively tighter through the end of 2023. Given the lags, the main impact of this policy will drag the economy down into a recession, with the worst hitting next summer and fall.
Look for signs of a downturn in the economy by early next year, if not sooner. The sooner these signs appear, the sooner the Fed will cease selling securities.
A major factor in any recovery will be the point at which the Fed decides to resume buying securities. At this point, it appears we are not yet close to such a development.
Sensitive Indicators
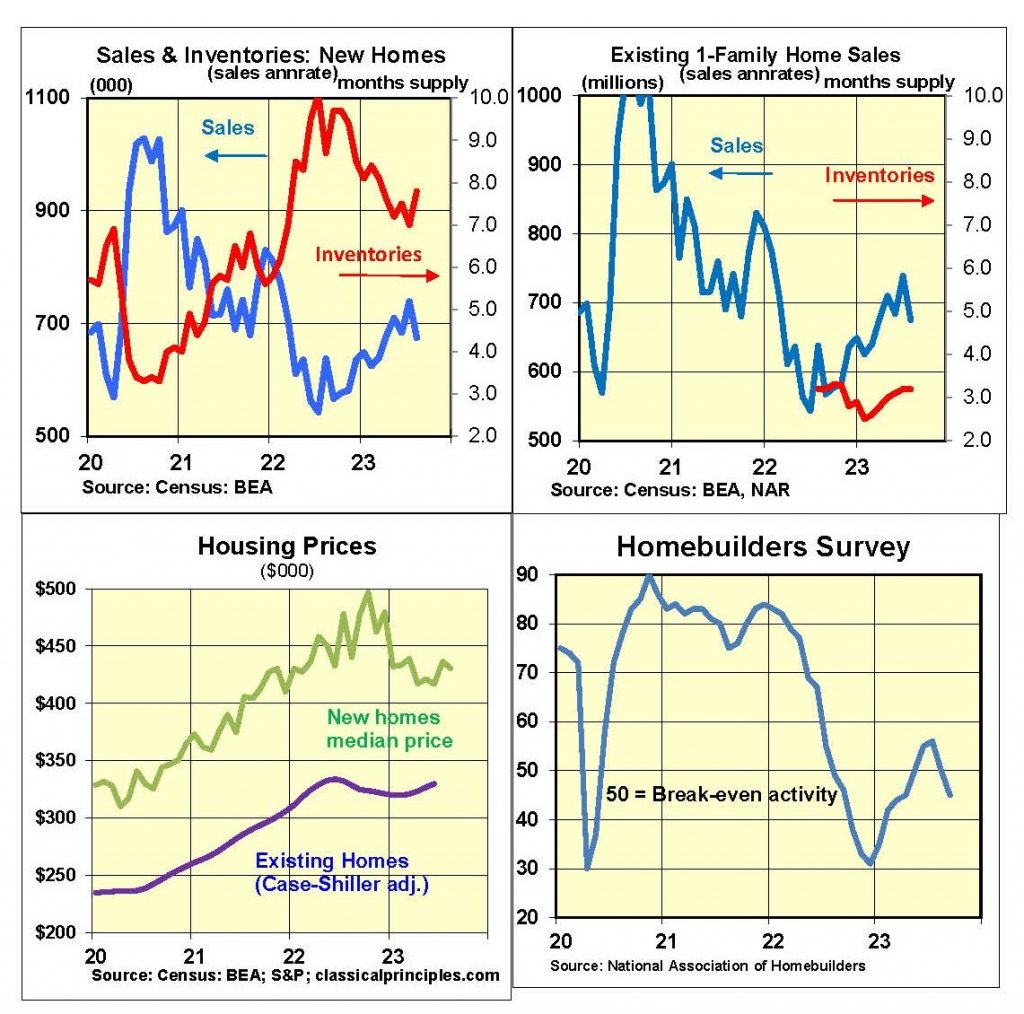
Sensitive indicators are mostly lower. Although housing sales and prices are up during the past six months, the primary trend is down. New home sales increased as builders lowered prices to reduce excessive inventories. Homebuilders’ confidence dropped into negative territory in September.
Existing homes also recovered amid a rush to buy as interest rates increased. August sales declined amid further increases in interest rates.
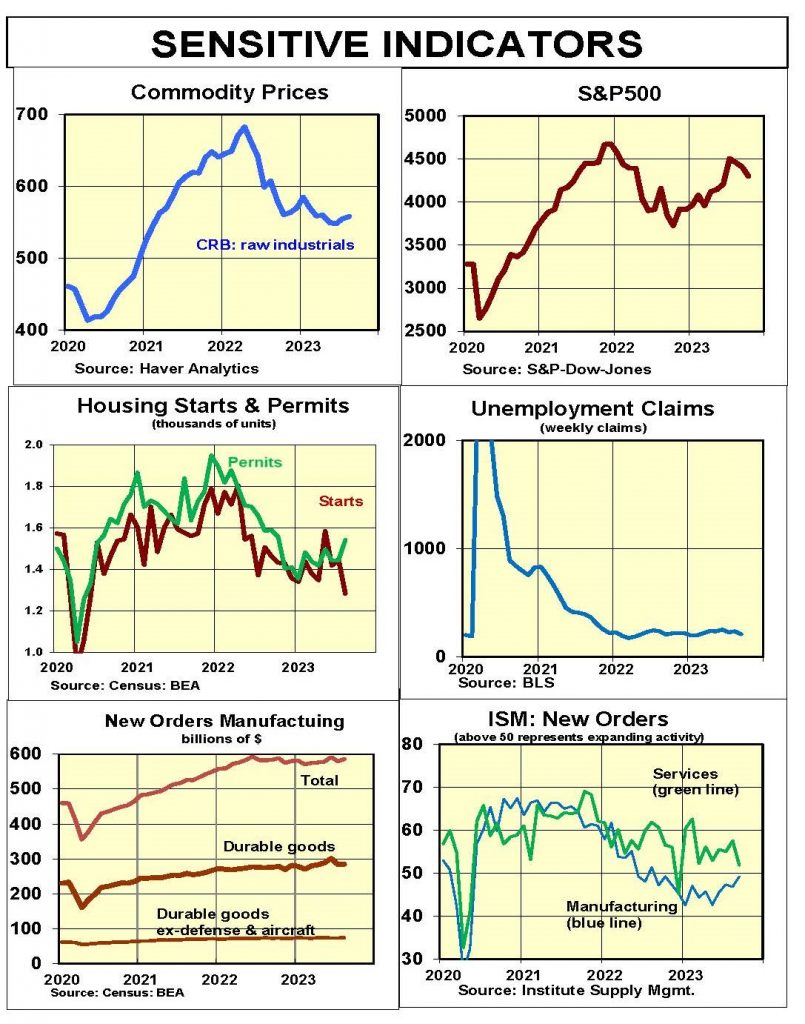
Raw industrial commodity prices are down 35 percent from their peak in March of 2022. The tentative upturn in stocks and housing activity has recently reversed.
Both the S&P and ISM business surveys for September show the economy still growing but slowing further.
Coincident indicators are mixed. Private payroll growth is slowing, but still relatively strong. The service sector continues to grow.
![]()
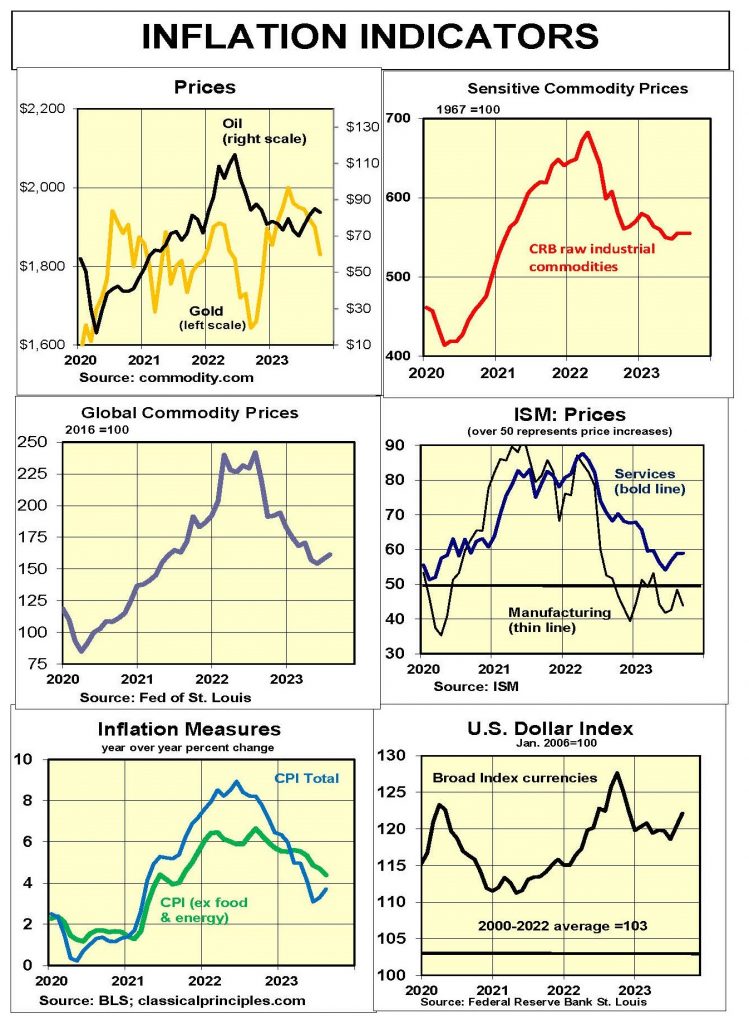
Inflation Indicators
The slowdown in the economy in the first two quarters of the year has reduced inflation. The spending (GDP) and income (GDI) measures show a growth rate of less than 5 percent in the second quarter.
Our forecast calls for further declines in overall spending and incomes. Although recent data point to a sharp increase in third quarter GDP estimates, we believe the overall trend will be toward slower spending and income growth followed by a downturn.
The most reliable and most current measure of inflation is the core CPI. The chart below shows both the annual (bold lines) and the six-month rates of change (thin lines) for the total and core inflation measures. Our analysis suggests the six-month core CPI provides the earliest reliable clue of a change in the direction of inflation.
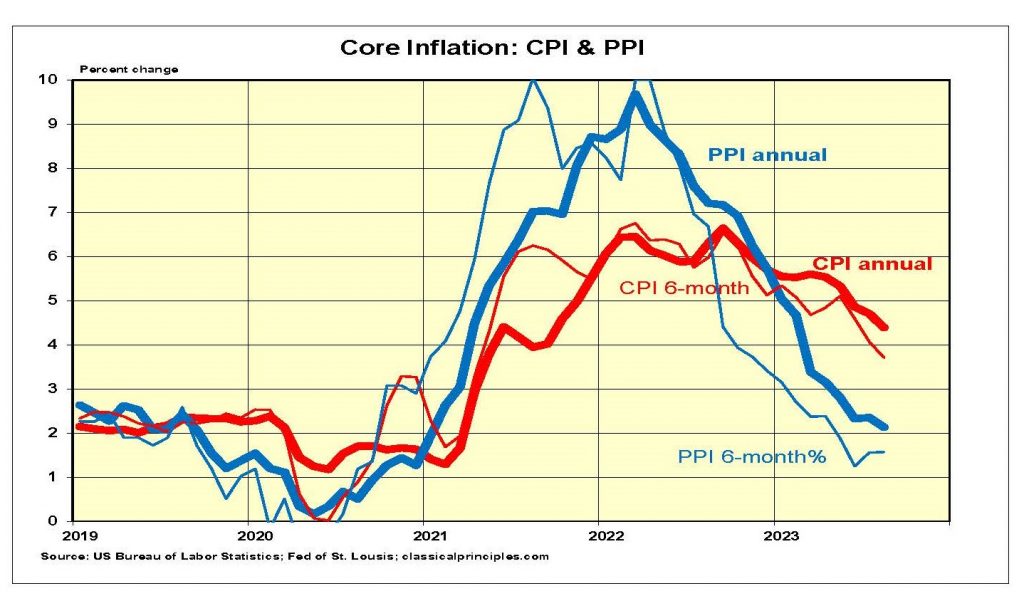
Although the year-over-year core CPI was 4.4 percent, the six-month moving average rate was 3.7 percent. The three-month rate (not shown) was even slower, at 2.4 percent.
Upcoming inflation numbers should continue to trend erratically lower. Look for the six-month rate of core inflation to dip to 3 percent early next year before moving to the 2 percent vicinity by this time next year.
Interest Rates
Two key forces will determine where interest rates peak. The first is inflationary expectations; the second is the limits to private demand for credit. All interest rate forecasts are highly speculative because of the rates associated with both expectations and credit demand are unknown.
Our measure of fundamental interest rates is based primarily on estimates of inflationary expectations. Currently they show expectations falling enough to bring the fed funds rate down next year and the 10-year rate down by early 2025.
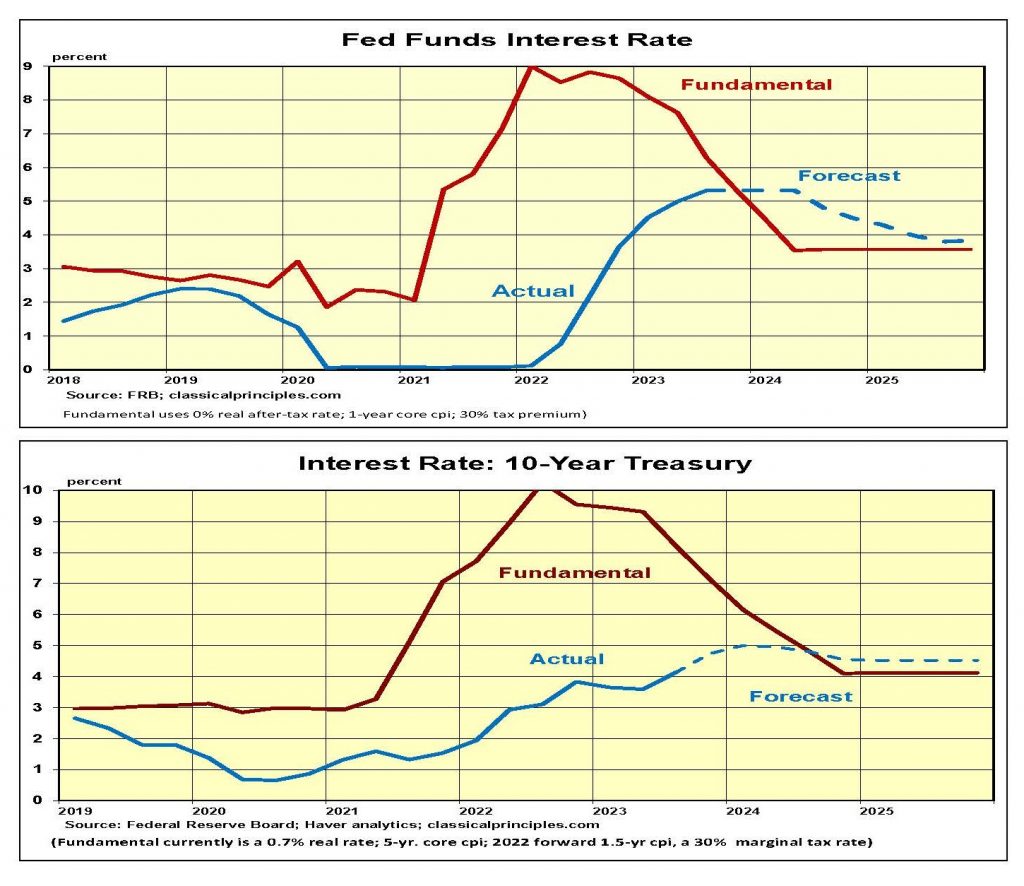
In an effort to convince investors it is serious about inflation, look for the Fed to keep the fed funds rate unchanged well into next year.
Longer-term interest rates were slow to respond to the risk of higher inflation. Correspondingly, expect them to take longer to react to signs of declining inflation. We expect the Fed to begin reducing short-term rates in the latter half of 2024. By 2025, short-term rates should move below the 10-year Treasury rate and restore a more normal yield curve.
Stock Prices
Our stock market model uses long-term trend S&P500 earnings and adjusts for interest rates. As interest rates move higher, the value of most assets declines. With the yield on AAA bonds at 5.6 percent, our model estimates the fundamental value of the S&P500 at 3,750. At the S&P500’s current value of 4,300, it is 15 percent overvalued.
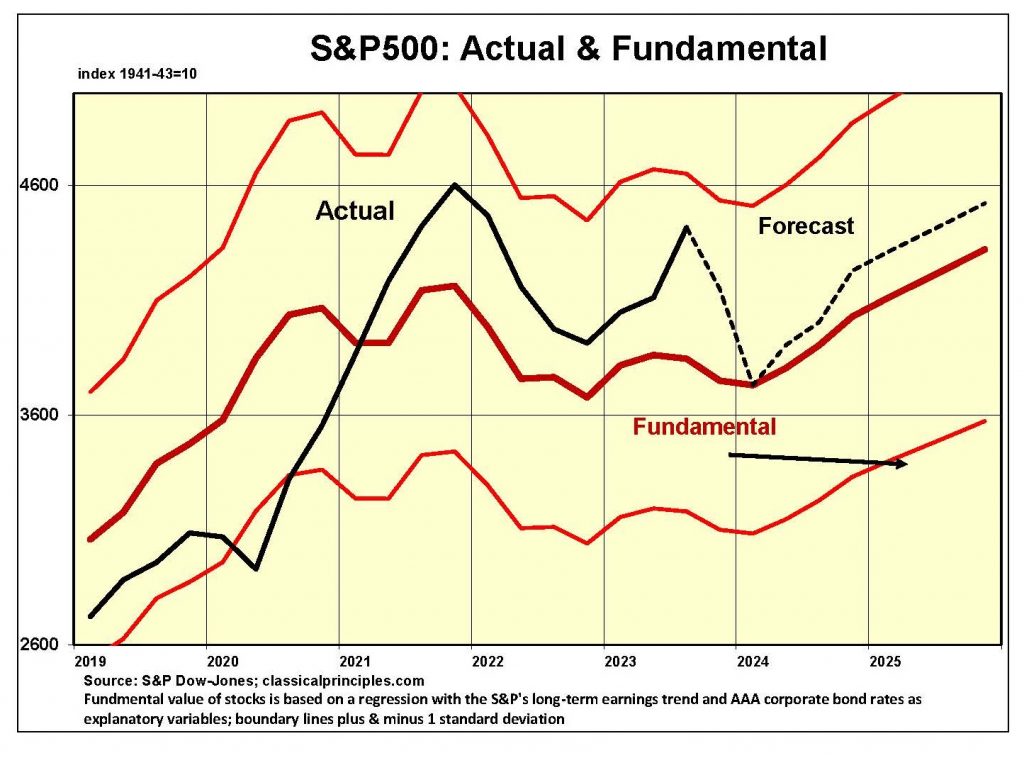
While the long-term earnings growth continues to drive the value of the S&P500 higher, interest increases in 2022 and this past year have led to a decline in the market’s fundamental value. Our assumption of a possible increase in the AAA bond rate to a peak of 6 percent in the first quarter of 2024 reduces the market’s fundamental value. Thereafter, our assumption of a gradual decline in longer-term rates helps to raise the value of stocks.
Despite our attempt to quantify precise numbers for interest rates and stock prices, such near-term expectations are highly speculative. Market psychology and Fed policy can change dramatically with monthly economic news. We continue to suggest investors with a shorter-term time horizon take a cautious approach to investing in stocks.
For more Budget & Tax News.
For more from The Heartland Institute.


")

