


A growing consensus indicates the economy is doing well. We continue to believe most people are struggling as monetary restraint works its way through the economy. Look for the economy to weaken further in the months ahead.
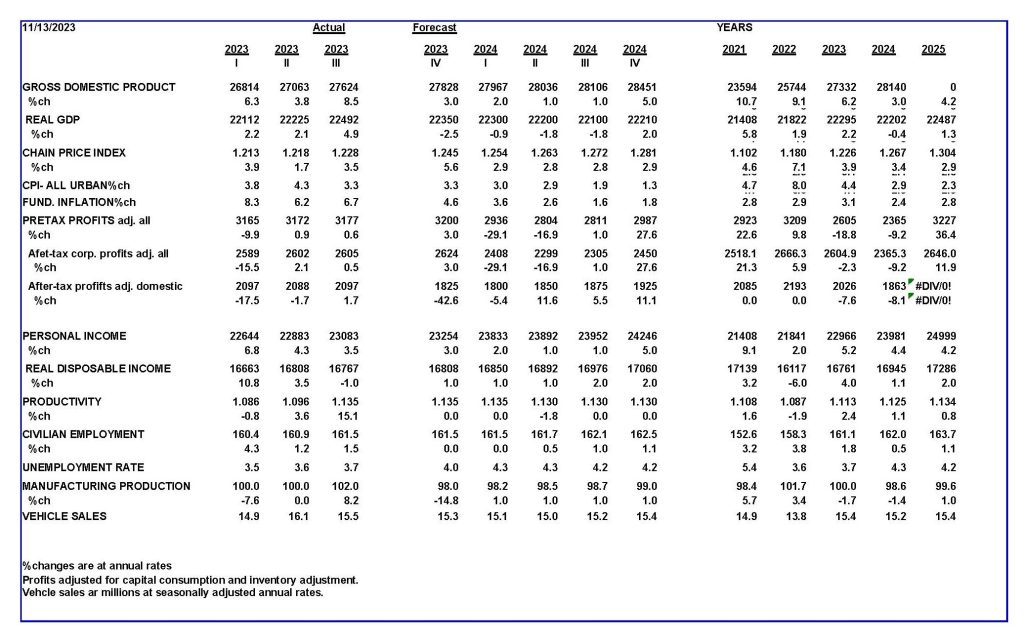
The government reported a surge in spending and growth this past summer. Spending grew at an 8½ percent rate, real growth by 5 percent, and inflation 3½ percent. It appears the economy is surging despite the Fed’s monetary restraint.
Appearances can be deceiving. There are two ways to view how the overall economy is performing. GDP is the most popular. It measures the economy by how much is spent. An alternative is GDI (gross domestic income) which measures the economy from income earned for producing what is spent.
These measures should equal each other. They often do not, because the data for almost all economic reports includes only small samples of these concepts. The chart below shows how measures from the spending side have tended to indicate more strength than those on the income side in the past year.
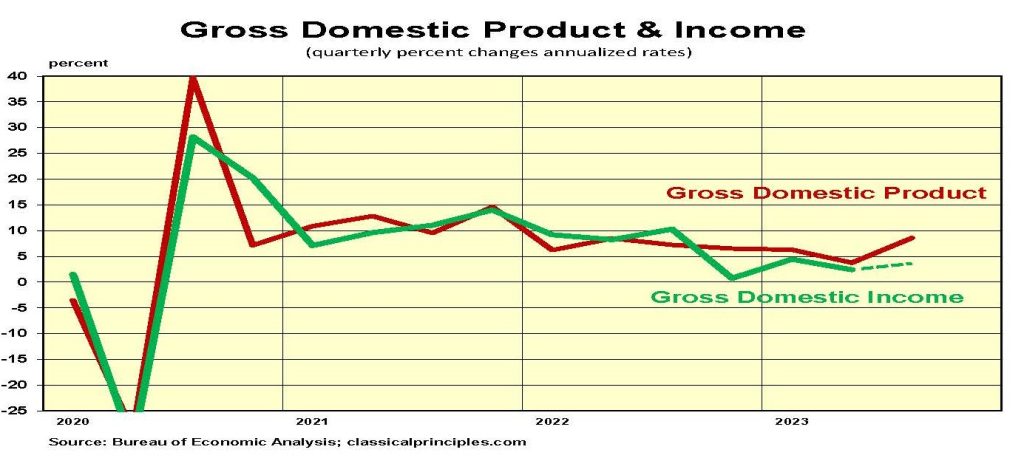
The GDI for the third quarter will not be available until the end of this month. However, roughly 80 percent of the information on income is available. It shows a 3½ percent annual rate of increase for the third quarter.
Monetary policy is growing progressively more restrictive as the Fed continues to sell securities. The lags in monetary policy suggest spending will continue to slow. Our forecast is for spending and profits to weaken significantly by the spring and summer of next year. We anticipate current dollar spending will slow to an annualized growth of only 1 percent to 2 percent as the lagged impact of money-tightening leads to negative real growth rates.
Monetary Indicators and the Economy
Monetary indicators point to policy being highly restrictive. Our preferred money measure shows the money supply in October was down 22 percent from a year ago. The dotted line extending through December assumes the Fed will continue to sell securities. At that time the money supply would be down 22 percent year-over-year. The two-year average growth would be down 2½ percent.
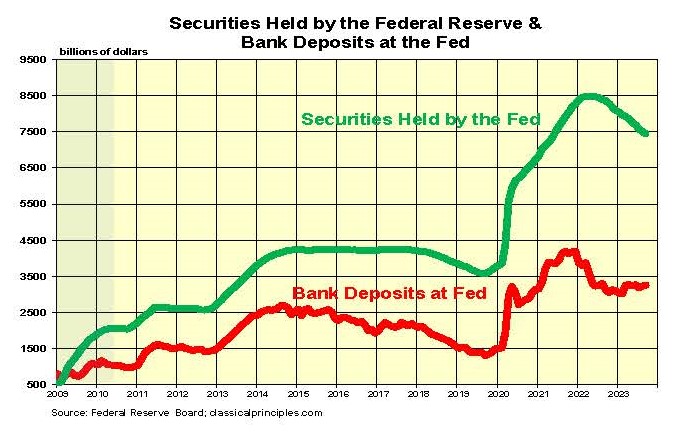
The main component of our money indicator is the Fed’s purchases and sales of securities. The Fed’s security holdings peaked in June 2022 at $8.5 trillion. Total sales through October of this year were just over $1.1 trillion.
The second component of our indicator is the change in bank deposits with the Fed. These declined sharply in 2022, offsetting much of the effect from the Fed’s initial security sales. For the past year bank deposits with the Fed have been essentially unchanged.
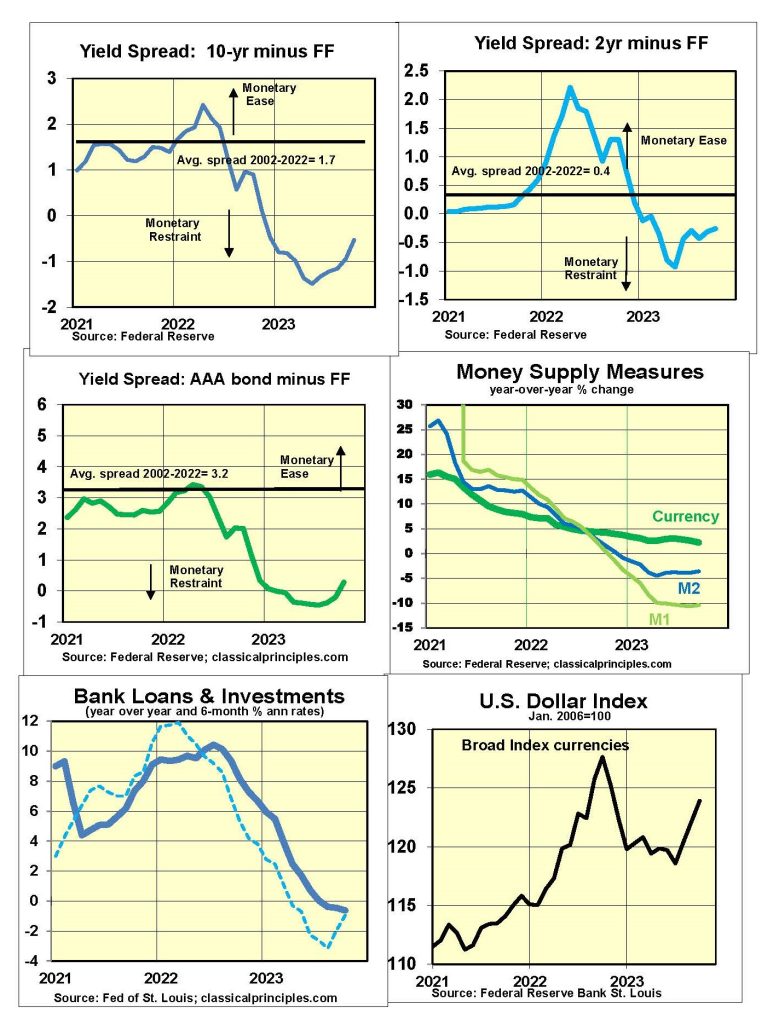
Alternative money measures confirm a restrictive policy is in place. M1 (currency and demand deposits) and M2 (M1 plus additional deposits) are down 10 percent and 4 percent, respectively, over the past year.
In addition to these measures, the yield curve also is inverted. The confirms how monetary policy is restrictive. Although yield curves have become slightly less inverted in recent months, it is not enough to indicate a meaningful change in monetary restraint.
History shows monetary restraint consistently leads declines in economic activity, with a variable lag of six to nine months, but lags can be shorter or longer.
The Fed is aware of these lags. Chairman Jerome Powell talks about them at each meeting. We assume the Fed will decide to hold the funds rate at 5.3 percent while continuing to sell securities. The Fed’s artificial interest rate can affect market psychology, but it is not the prime driver of monetary policy at this point. The key driver is the selling of securities.
If we are correct, the Fed’s monetary policy will become progressively tighter through to the end of 2023. Given the lags, the main impact of this policy will drag the economy down into a recession, with the worst hitting next summer and fall.
By early next year look for signs of a downturn in the economy. The sooner these signs appear, the sooner the Fed will cease selling securities.
A major factor in terms of any recovery will be the point at which the Fed decides to resume buying securities. Today, it appears we are at least six to nine months away from such a development.
Sensitive Indicators
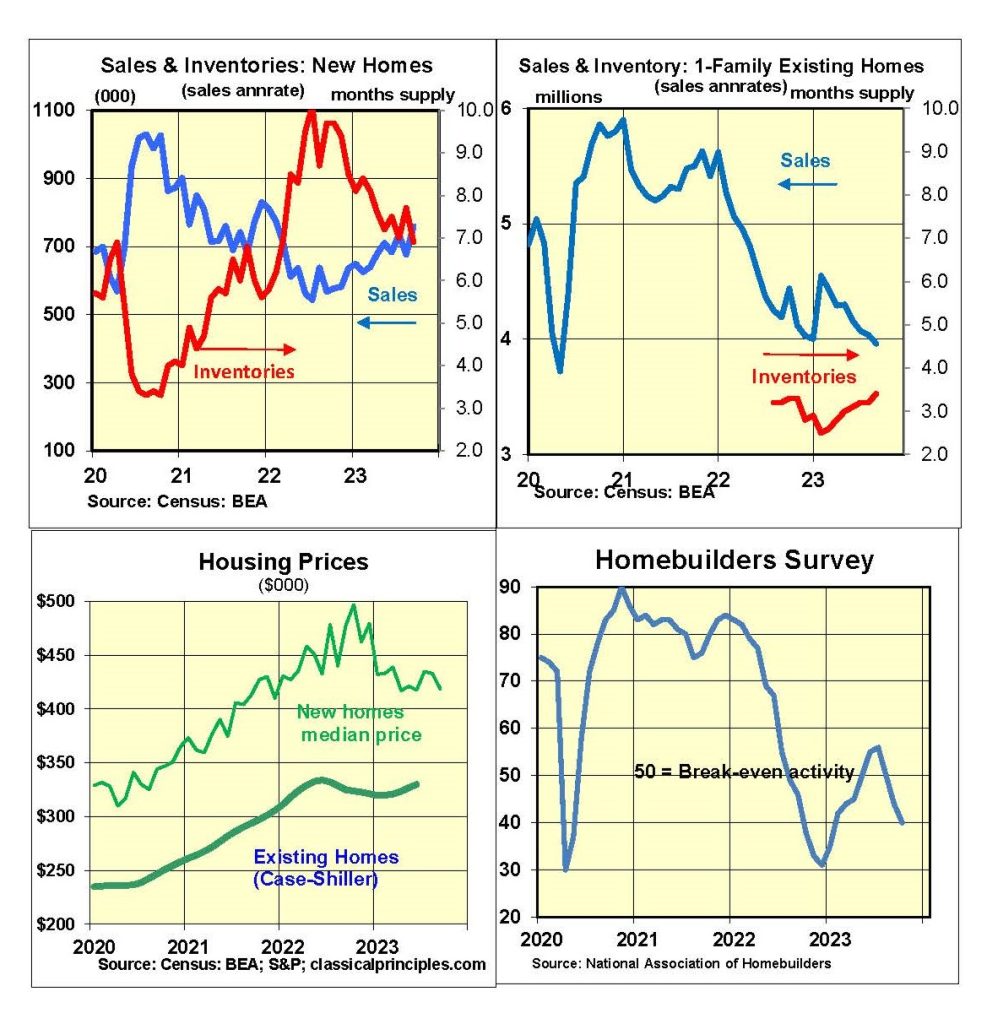
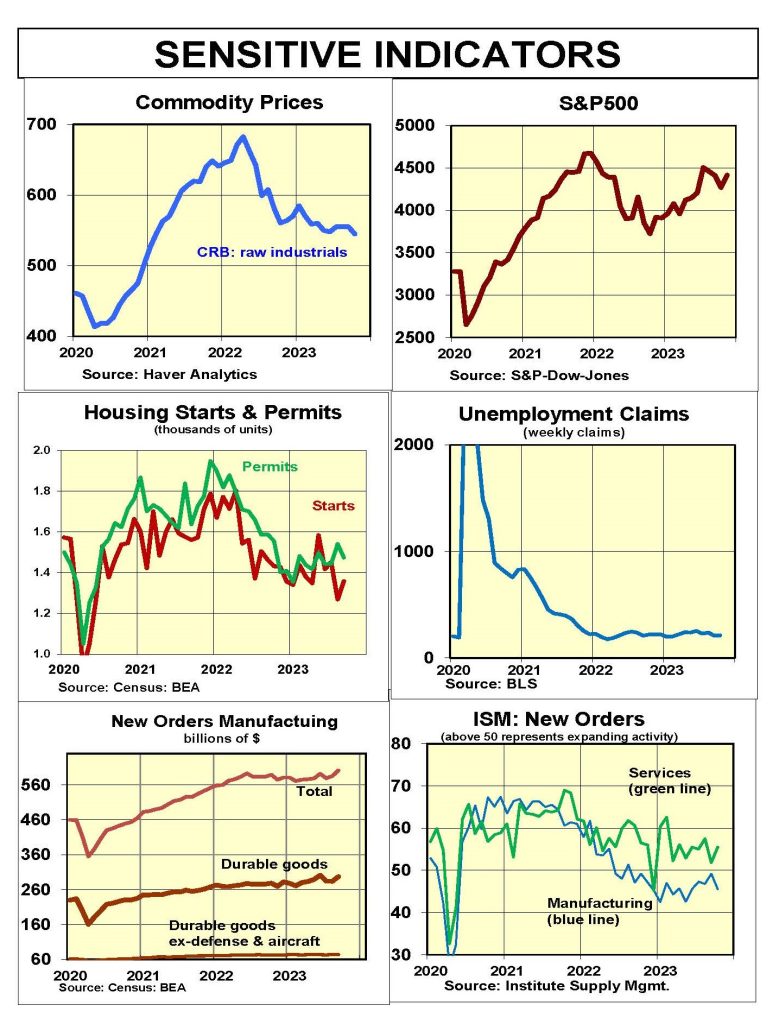
Sensitive indicators are mostly lower. The Homebuilders’ index went deeper into negative territory in October. Sales of existing homes are down sharply from the beginning of last year, and prices of existing homes have leveled off. New home sales recently moved higher as builders reduced prices to cut inventories.
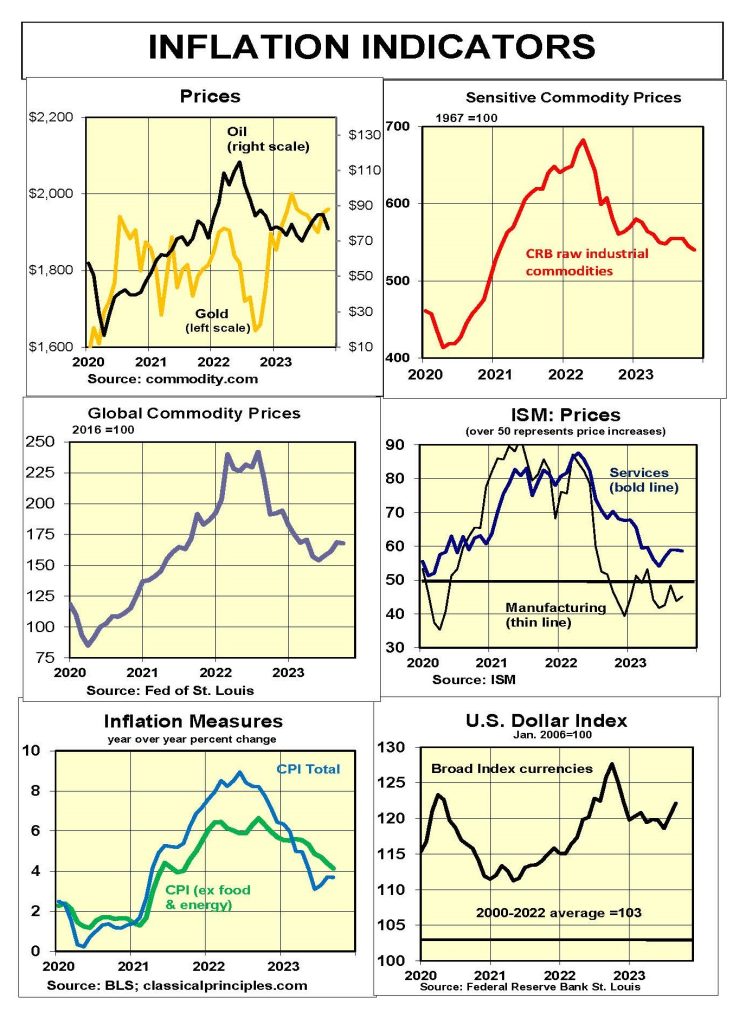
Raw industrial commodity prices are down 35 percent from their peak in March of 2022. The tentative upturn in stocks and housing activity has recently reversed.
Both S&P and ISM business surveys for September show the economy slowing further but still growing.
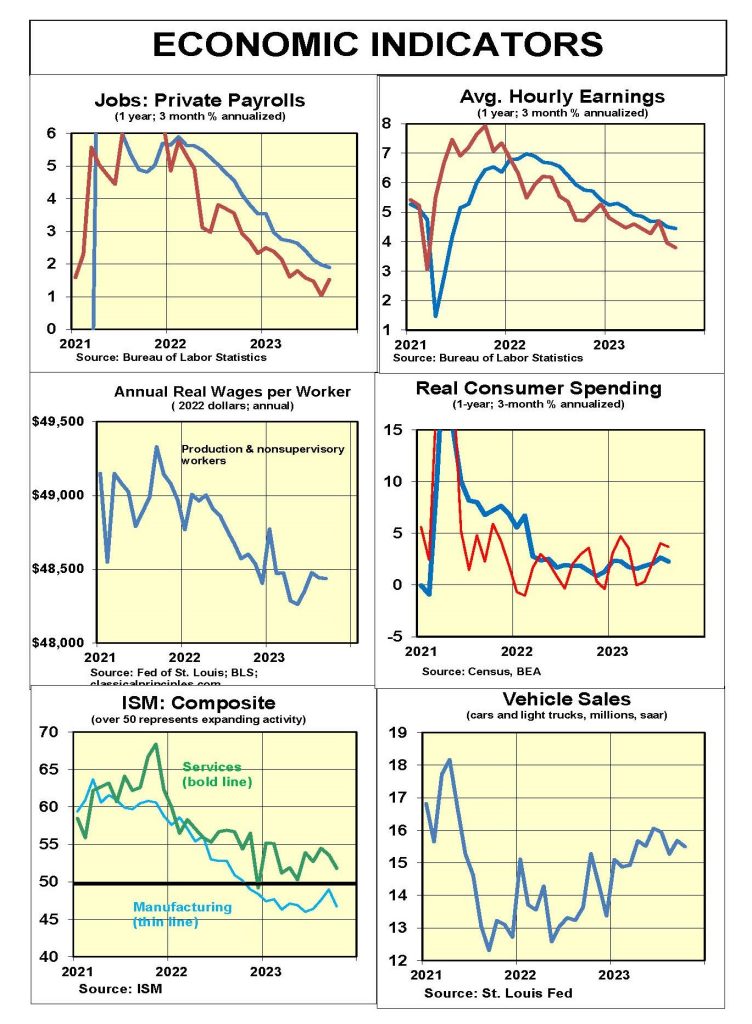
Coincident indicators are mixed. Private payroll growth is slowing, but still relatively strong. The service sector continues to grow.
Inflation Indicators
The most reliable early signs of a change in inflation are in the core CPI over a six-month period. As the following chart indicates, the downward trend in core CPI continues.
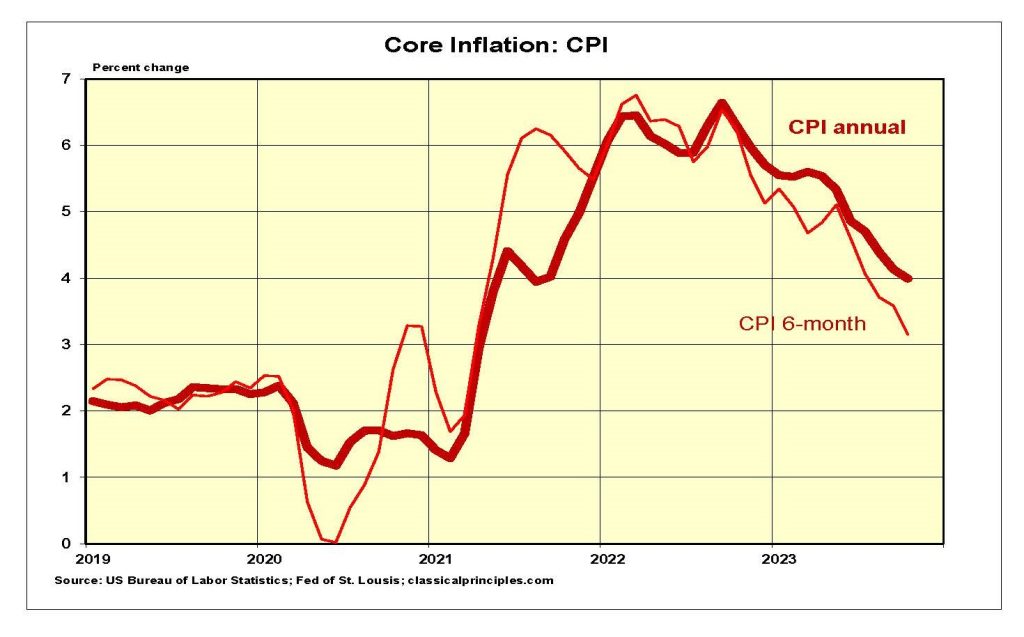
Unfortunately, for the 12 month period ending in October the core CPI rate remains at 4 percent. This makes it difficult for the Fed to declare success in containing inflation. On a slightly more encouraging note, the three- and six-month rates of inflation in October were just over 3 percent.
The October ISM survey continues to report serious inflation pressures in the service sector, which remains a problem for further reducing inflation.
The apparent speedup in spending during the summer and into September presents another challenge in reaching the Fed’s 2 percent inflation target. Strong spending and weak productivity are a formula for keeping inflation above the Fed’s target.
Our analysis continues to show the economy weakening in the year ahead. This weakness should help drive inflation down to the Fed’s target by the middle of 2024.
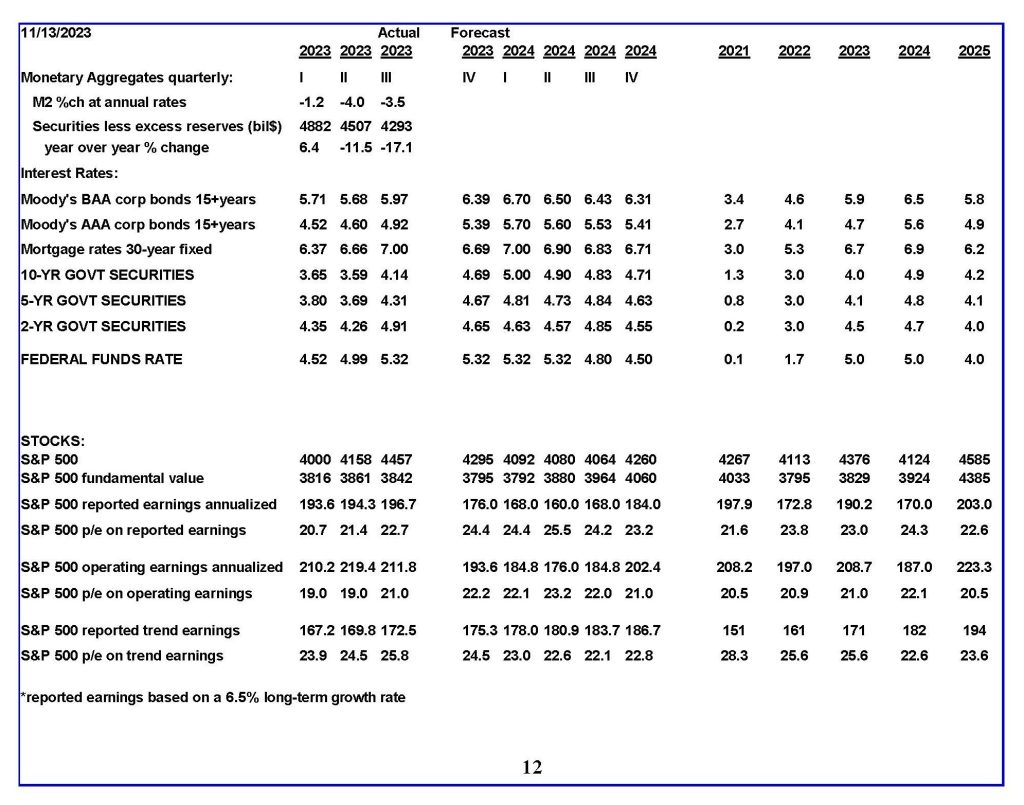
Interest Rates
Our measure of fundamental short- and long- term interest rates is based primarily on estimates of inflationary expectations. Currently they show expectations falling. This would enable the Fed to keep the fed funds rate at its current level and begin reducing it by the middle of next year.
A similar analysis shows the fundamental yield on the 10-year T-Note declining. If inflationary expectations continue to fall, longer-term rates likely will have peaked in the vicinity of 5 percent.
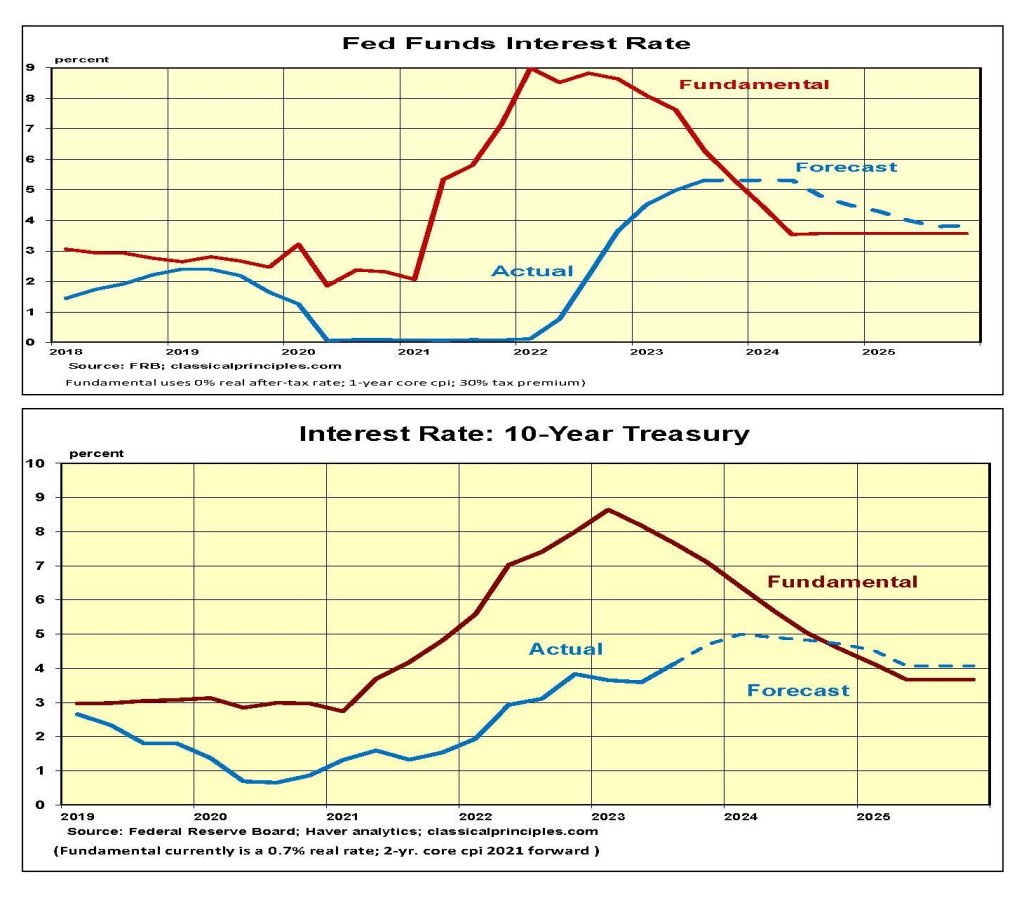
Two key forces will determine the precise level at which interest rates peak. The first is inflationary expectations; the second is the limits to private credit demand. All interest rate forecasts remain highly speculative because of the unknown rates associated with upcoming inflation data, inflationary expectations, and credit demand.
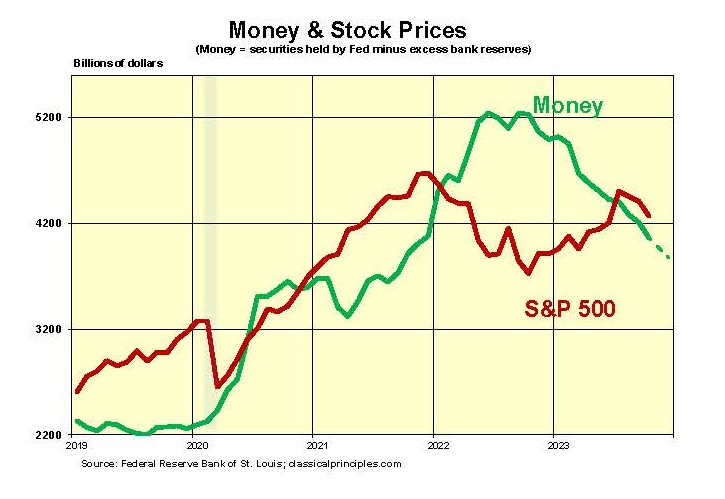
Stock Prices
With 88 percent of companies reporting, third quarter S&P500 earnings are up slightly from the second quarter. Since its peak in the fourth quarter of 2021, S&P earnings are down 9 percent, and the S&P500 stock index is down 7 percent.
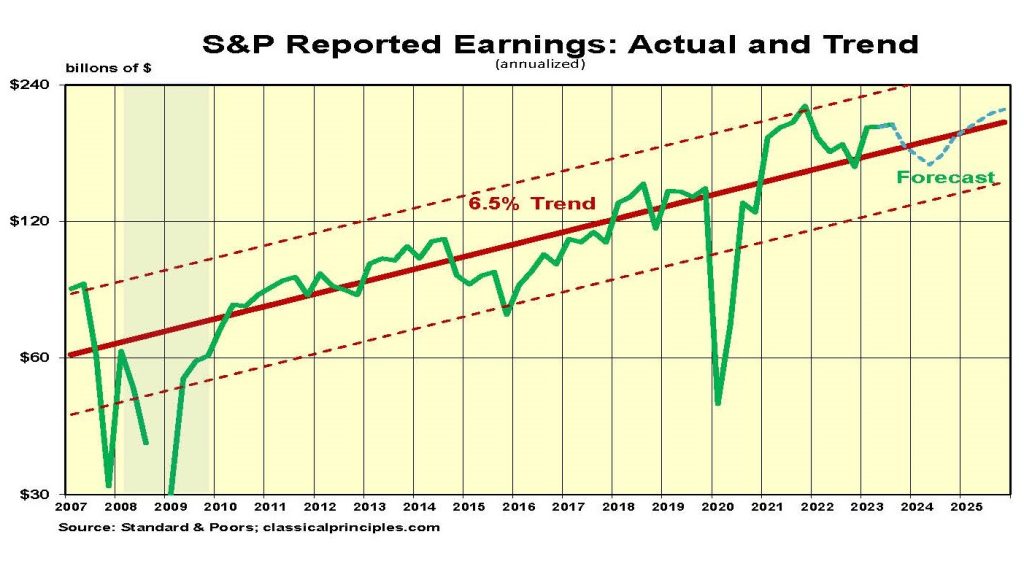
Stock prices follow earnings. Third-quarter earnings were 14 percent above the long-term S&P earnings trend. Our stock market model uses long-term trend S&P500 earnings and adjusts for interest rates. As interest rates move higher, the values of most assets decline.
For the third quarter, the price of the S&P500 index was 16 percent above our estimate of fundamental value. Hence, both earnings and stock prices were overvalued by close to the same margin.
Market psychology and Fed policy can change dramatically with monthly economic news. Our forecast for a weak economy and declining profits points to the potential for some downward pressure on stock prices. We continue to suggest investors with a shorter-term time horizon take a cautious approach to investing in stocks.
For more great content from Budget & Tax News.
For more from The Heartland Institute.


")

