


New perspective on America’s $25 trillion War on Poverty is given by a measure of absolute, rather than relative deprivation.
By James Pethokoukis
I suppose if you’re someone who thinks American capitalism has failed and unironically uses the phrase “late capitalism,” there’s probably no changing your mind. So I guess this post is meant for folks who have concerns about the American economy yet also have an open mind about new information. For this group, I have a new study they may find interesting — perhaps even perspective-altering:
For example: Do you think America neglects the poor? Sure, the national poverty rate has fallen by half since the 1960s, from 19.5 percent in 1963 to 10.5 percent in 2019, according to the official US poverty measure. But one might reasonably question whether that’s really a good return on investment given the massive size of the investment, some $25 trillion to reduce material deprivation.
A different view is offered by the new paper, “Evaluating the Success of President Johnson’s War on Poverty: Revisiting the Historical Record Using an Absolute Full-Income Poverty Measure” by Richard V. Burkhauser (Cornell University), Kevin Corinth (University of Chicago), James Elwell (Joint Committee on Taxation), and Jeff Larrimore (Federal Reserve Board). They try to evaluate LBJ’s War on Poverty in a way that would make sense to those who launched it.
To do this, the researchers created a new poverty measure that meets three key conditions: Firstly, its poverty rate in 1963 should align with the approximately 20 percent level Johnson identified, serving as a benchmark. Secondly, the 1963 poverty thresholds (poverty line) should be kept constant, adjusted only for inflation. Thirdly, the measure should encompass all anti-poverty programs, including cash, in-kind transfers, and tax-related transfers.
From the paper:
To fill this gap, we create a poverty measure, which we refer to as the absolute Full-income Poverty Measure (FPM). This measure maintains the same 1963 poverty rate as the Official Poverty Measure, matching Johnson’s baseline poverty rate (Johnson 1965). We hold poverty thresholds constant in inflation-adjusted terms using the Personal Consumption Expenditure (PCE) price index, which more accurately reflects price changes than the CPI-U inflation measure used for the Official Poverty Measure. Additionally, unlike the Official Poverty Measure, we include both cash and in-kind programs designed to fight poverty, including the market value of food stamps (now the Supplemental Nutrition Assistance Program, or SNAP), the school lunch program, housing assistance, and health insurance. Finally, we incorporate in a consistent way the technical improvements in how income is measured since the 1960s in both our measure of full income and in the new thresholds we create to anchor our new FPM poverty rate to the official poverty rate of 19.5 percent in 1963. Based on Johnson’s standard and making these technical improvements to the official measure, our absolute FPM poverty rate in 2019 is 1.6 percent, well below the official poverty 5 rate of 10.5 percent.
Let’s be clear on this finding: Based on today’s living standards and our own expectations, there are Americans struggling financially on a relative basis. But as the paper concludes:
Consequently, while recognizing that today’s expectations for minimum living standards have evolved from those in the 1960s, a relatively small share of Americans now live in poverty based on President Johnson’s initial standards. And President Johnson’s War on Poverty based on absolute 1960s living standards is largely over and a success.
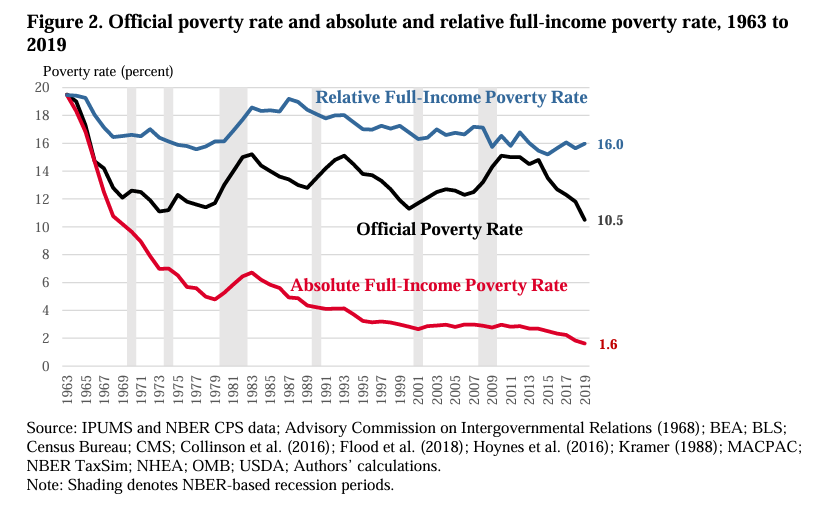
So what would the poverty rate be if it were more in line with current living standards and expectations? Additionally, the authors created a “relative FPM,” which shows that little progress has been made in improving the relative living standards of low-income households, with the poverty rate dropping only slightly from 19.5 percent in 1963 to 16.0 percent in 2019.
This relative measure adjusts yearly thresholds in line with median income changes. “The dramatic reduction in poverty by 2019 based on President Johnson’s absolute 1960s standards suggests that policymakers might consider setting new poverty thresholds that reflect modern-day expectations for what it means to be impoverished,” the authors write.
Indeed, the wrong conclusion here would be that nothing more needs to be done to help lower-income Americans live the sorts of lives that our society decides are at least minimally acceptable — especially lives built around better-paying jobs. What we do matters, and we can improve people’s lives through our collective efforts via public policy.
Originally published by the American Enterprise Institute. Republished with permission.
For more Budget & Tax News.


")

