

The ongoing strength in stock prices and the economy raise questions about the reliability of money as a guide to the economy. History, however, suggests we should pay close attention to money in anticipating the likely course of business activity. The Fed’s move to money scarcity indicates a possible reversal of recent economic growth.
by Robert Genetski
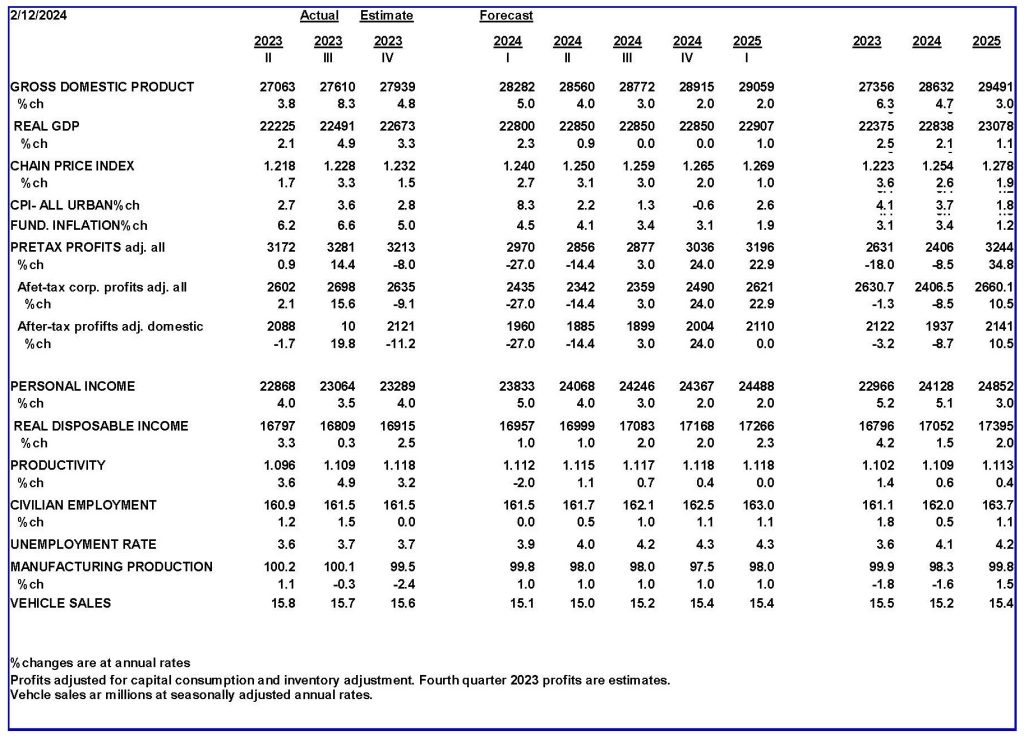
Recent data show the economy growing at a strong 3.4 percent rate in the first quarter. As a result, there is a growing consensus that the growth will continue. After more than a year of monetary restraint, many are ignoring the potential for a scarcity of money to disrupt business activity.
Our extensive review of monetary history since the establishment of the Federal Reserve in 1914 shows the money supply has been and continues to be directly related to the economy.
Almost every recession since the Federal Reserve was established in 1914 has been preceded by the Fed selling securities. The two most recent recessions were also preceded by sales of securities.
The chart below shows the sharp drop in security sales prior to the “Great Recession” of 2008.
 Even the brief two-month recession in April and May of 2020, (which was directly related to the government shutdown), was preceded by the Fed selling securities along with a lack of money during the crucial second quarter of 2020.
In spite of clear historical evidence of the potential damage from large changes in the Fed’s portfolio, the Fed has become more intent than ever on using this powerful tool to drive the economy.
Since 2008, the Fed’s purchases and sales of securities have become so extreme, percent changes actually distort their relationship to the economy. Transforming data to log forms, as in the chart above, will often provide a clearer picture of the relationship between money and the economy.
The Fed’s Dilemma
In 2021, members of Congress questioned Fed Chair Jerome Powell over concern the Fed’s rapid increases in money would create inflation. Powell said the Fed no longer paid attention to money, because the M2 measure of money was not reliable.
In one sense, Powell was correct. The relationship between M2 (currency plus most bank deposits) had not been closely related to changes in GDP from 1990 to 2019. M2 had become a less reliable money measure.
Unfortunately for Powell and the Fed, purchases of securities in 2020 to 2022 were so great, almost any measure of money, including M2, correctly predicted a sharp rise in inflation.
Amid the highest inflation in 40 years, the Fed had egg on its face. In 2022, the Fed was forced to raise interest rates and sell securities to remove the excess money and fight inflation.
The Fed’s problem was it did not have a reliable measure of money. Our analysis indicates that incorporating the Fed’s purchases and sales of securities can produce a money measure that captures major changes in GDP.
While there is no ideal measure of money, one fairly reliable measure is one that includes currency, the Fed’s holdings of securities, and bank deposits held at the Fed. We previously referred to this measure as raw money. A more conventional term would be high-powered money (abbreviated as HP$).
The following chart shows the relationship between changes in HP$ and changes in GDP.
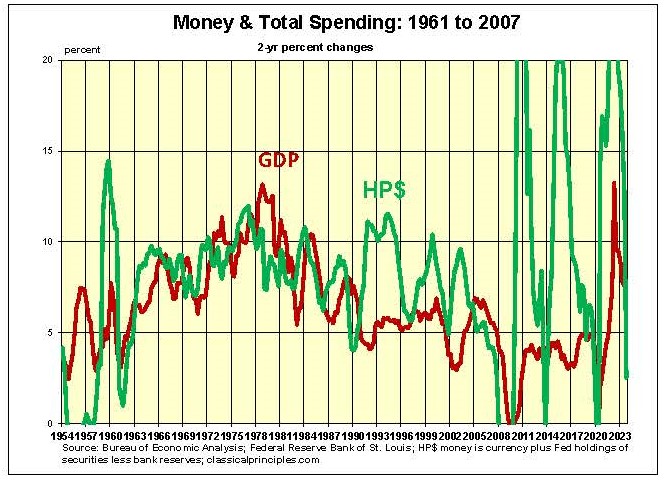
Historically, HP$ captures major turning points in the economy prior to major changes in GDP. Although HP$ captures major turning points, it is far more volatile than changes in GDP. Purchases and sales of securities have often been the main source of changes in HP$.
Recent Monetary Developments
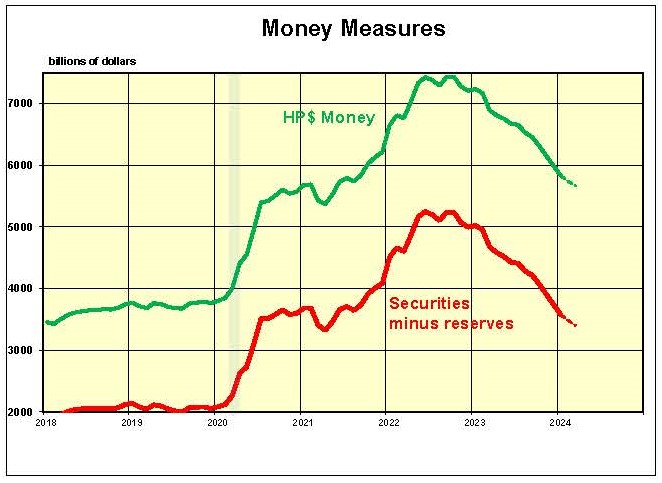
After the Fed’s holdings of securities peaked at $8.5 trillion in the spring of 2022, the Fed began selling securities. However, by August, 2022 total sales amounted to only $75 billion. Over that same period, banks offset these sales by shifting more than $300 billion of their deposits from the Fed into the economy.
Monetary restraint did not begin until December, 2022. By that time both the Fed and banks moved to remove money from the economy. The following chart shows the relationship between HP$ and securities and bank reserves in the past few years.
The lag between sales of securities and a recession has usually been three to four quarters. If our current cycle had kept to the average, the recession would have started by the last half of 2023.
No two business cycles are the same. The current cycle is unique. The initial surge in money in 2020 was followed by a year of no increase. This was followed by another surge just prior to the decline. This unprecedented on-again, off-again volatility has sent conflicting signals through the economy. Conflicting signals reverberate through the economy, often creating confusing signals about the underlying trend.
In the chart below, we smooth out some of this volatility by taking the two-year average change in both HP$ and GDP. Unlike most cycles, where the change in money hits its peak or trough prior to GDP, in this cycle the major turning points are coincidental. This is likely due to the extreme nature of the change in money.
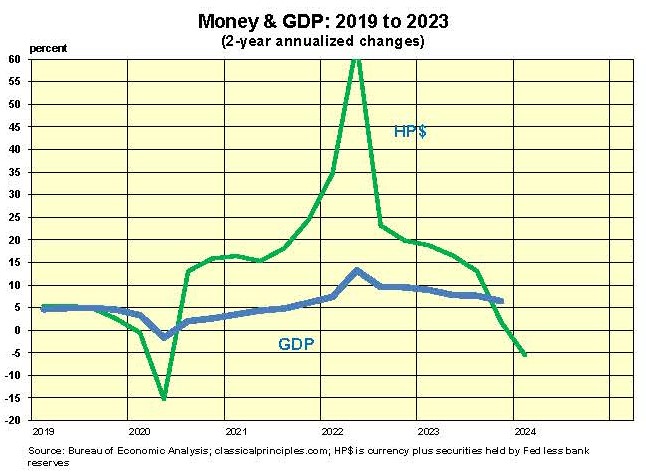
The chart also shows an estimate of HP$ for the first quarter of this year. The estimate is based on the Fed’s announcement of its ongoing sales of securities.
Regardless of the money measure used, it should always be verified by other monetary indicators.
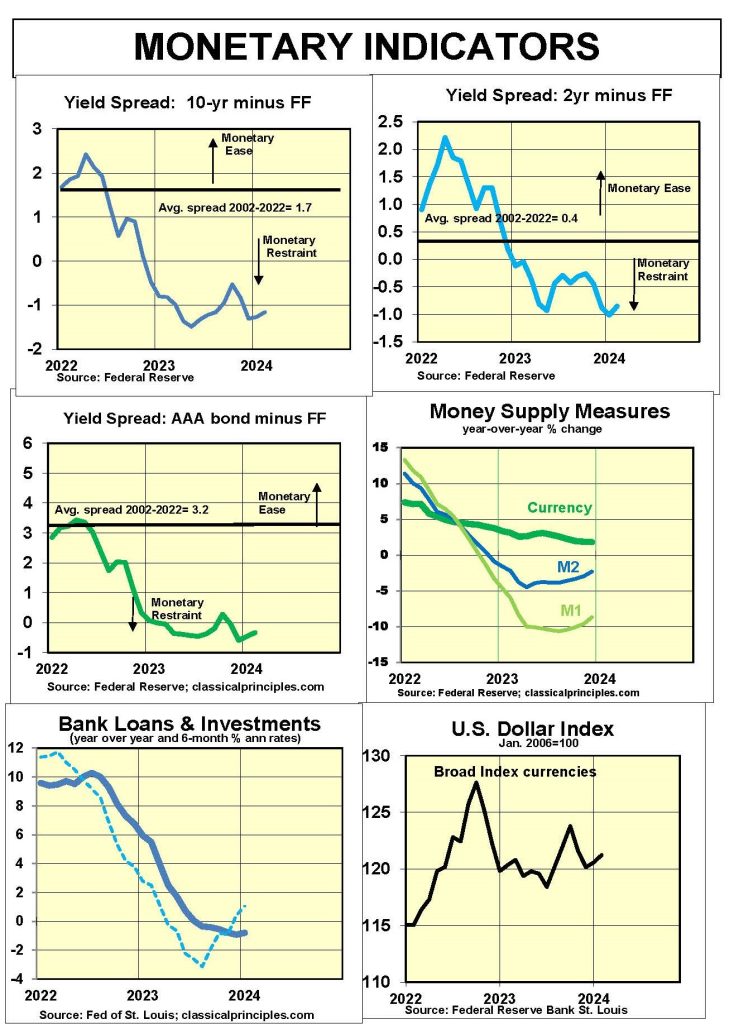
Inverted yield curves have consistently been a reliable sign of a tight money policy. As the charts below show, yield curves through February remain at or beyond their maximum inversion.
Given the current conflict over the direction of the economy, we suggest closely monitoring variables that tend to provide early signs of change in monetary restraint.
The first is yield curves. So long as yield curves remain inverted, it indicates monetary policy remains highly restrictive.
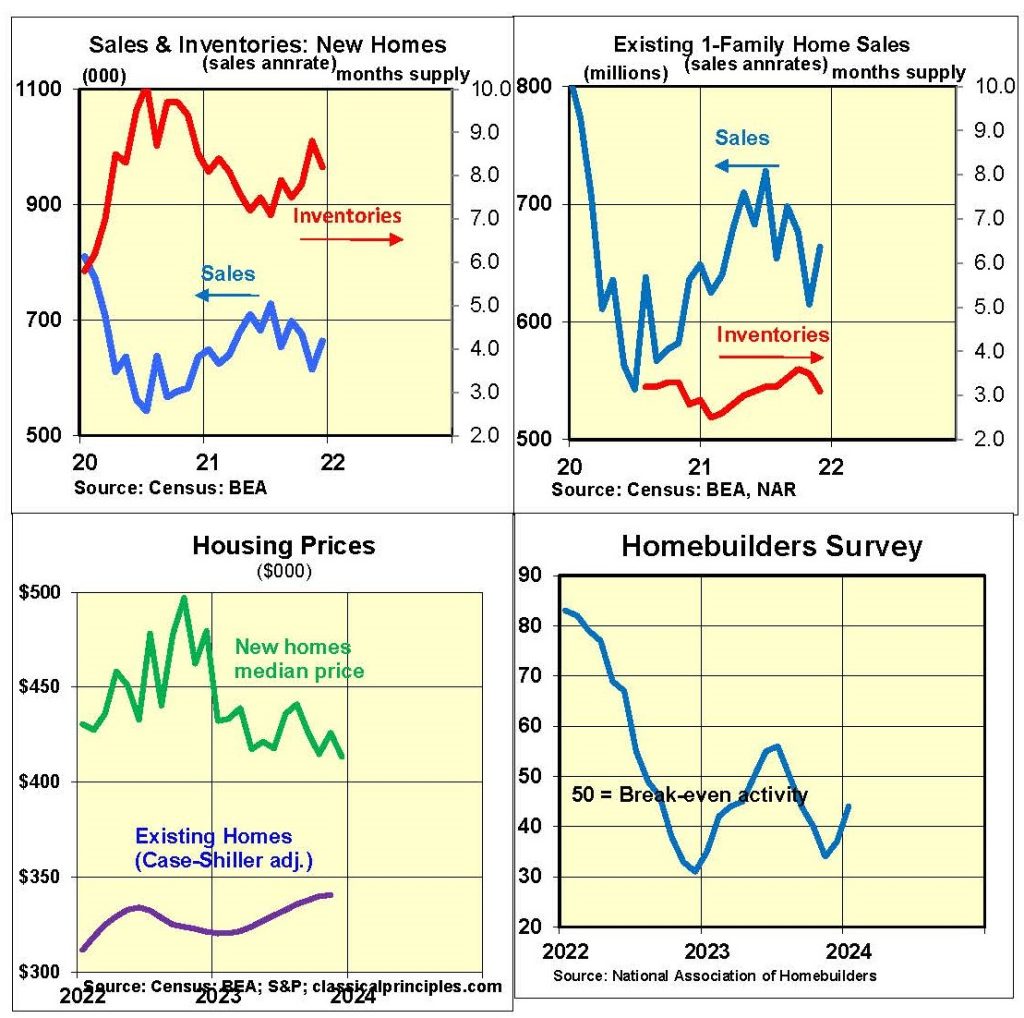
The second is housing. Negative readings from the Homebuilders’ Index and other housing measures provide additional evidence of a scarcity of money.
The apparent ongoing strength in the economy indicated by stock prices seems to reaffirm the consensus that all is well. Nonetheless, the odds of renewed weakness in business activity remain high.
Sensitive Indicators
One way to anticipate the extent of a potential economic downturn is to track sensitive economic indicators. Unfortunately, two of the most reliable indicators—housing and stock prices—are pointing in different directions.
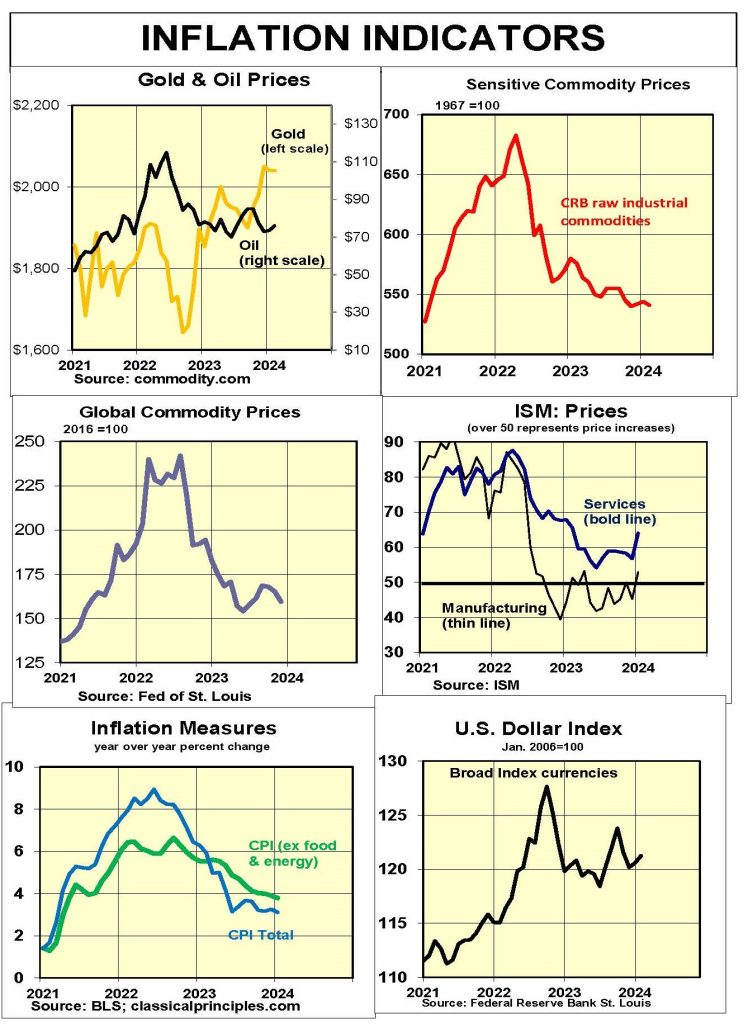
Housing activity has been one of the most reliable early indicators of a downturn in the economy. Most housing indicators are pointing to a serious downturn. Despite a drop in mortgage interest rates, the December Homebuilders’ index remains in negative territory. Sales of both new and existing homes are down sharply. Raw industrial commodity prices also remain depressed.
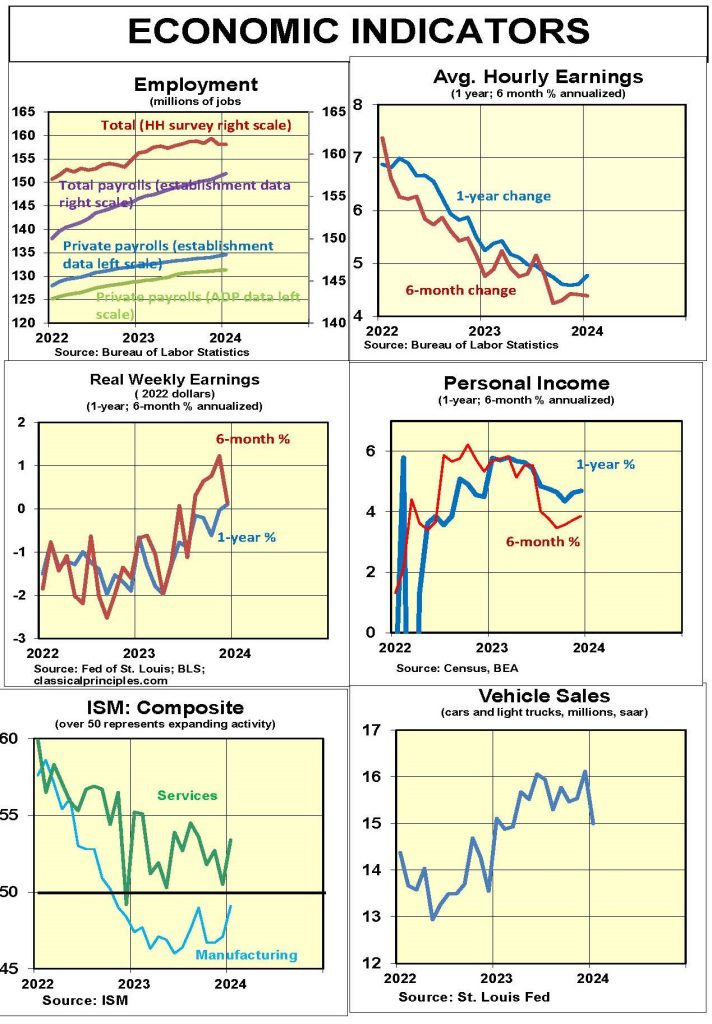
In contrast to housing, stock prices and the January ISM business surveys for new orders are both pointing to further strength in the months ahead.

Inflation Indicators
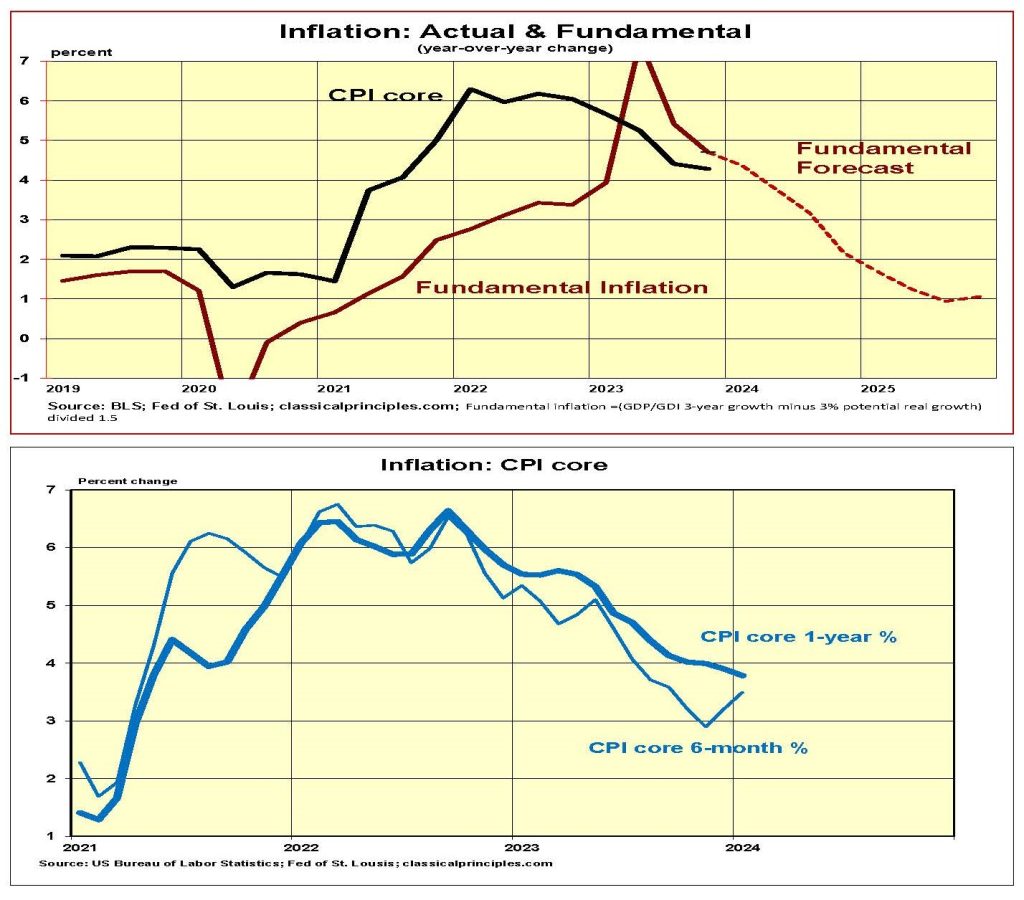
Inflation continues to decline, but only gradually. Our estimate of the underlying or fundamental inflation rate shows yearly inflation currently in the 3 percent to 4 percent range and falling to the 2 percent vicinity by the end of this year. The main force driving inflation lower is our projected slowdown in current-dollar GDP.
The second chart below shows actual inflation through January. Both the year-over-year and six-month core inflation rates remain above 3 percent. However, if current-dollar spending (GDP) continues to increase at a 5 percent annual rate in 2024, inflation will remain uncomfortably high.
This is why Chairman Powell insists that interest rate cuts are currently off the table. Financial markets will continue to postpone pricing-in the timing of a rate cut until there are more signs of a slowdown in the economy.
If the economy slows as we expect, short-term interest rates will begin heading down by the third quarter of 2024.
Interest Rates
Our measure of fundamental short- and long-term interest rates is based primarily on inflationary expectations. With inflation moderating, expectations for future inflation are declining.
Our estimate of the fundamental or market rate for short-term rates is moving below the Fed’s target. We expect it will take another six months before the Fed is prepared to lower its target rate.
A similar analysis of the fundamental yield on the 10-year T-Note is also declining towards 4 percent. The speed at which it declines depends on the market’s perception of the Fed’s commitment to reach its inflation target. We expect the Fed’s resolve to achieve its target will keep the 10-year Treasury anchored near the 4 percent vicinity for an extended period.

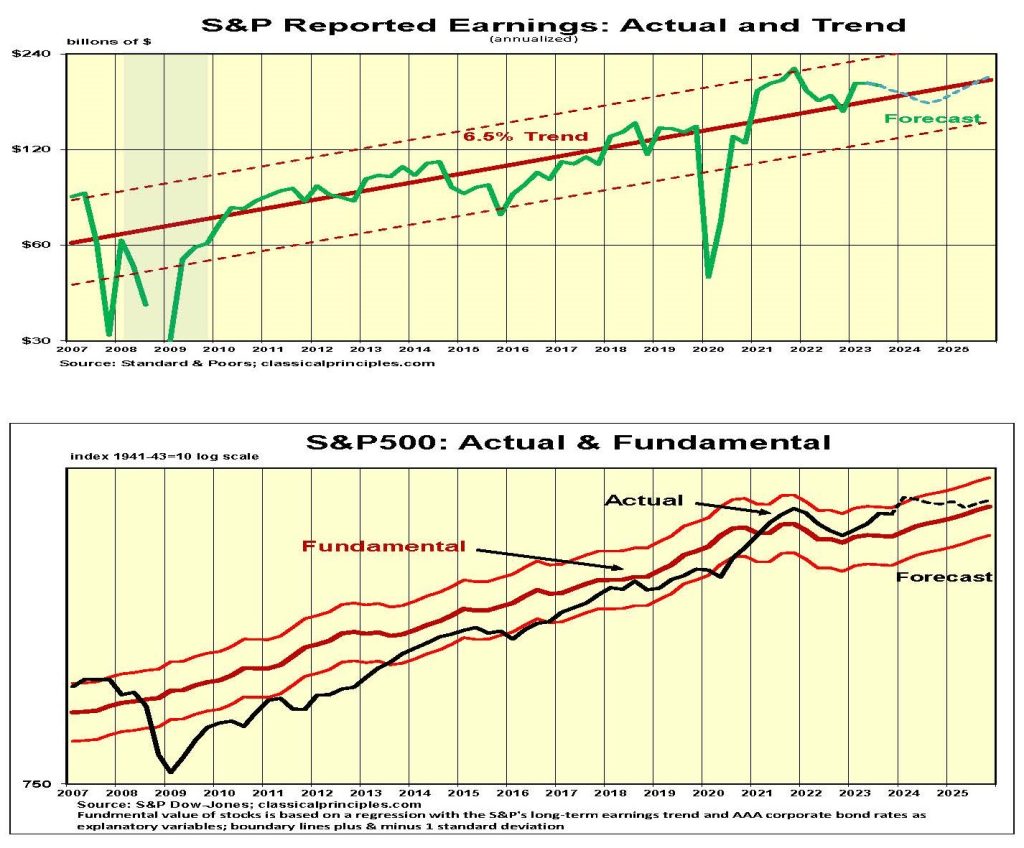
Stock Prices
Although fourth quarter S&P500 earnings were down slightly from the second and third quarters, they remained about 5 percent above the longer-term earnings trend.
The current consensus is for moderate growth in the economy along with a sharp increase in earnings. Analysts expect a 27 percent rise this year. At 5,000, the S&P500 reflects these optimistic assumptions.
In contrast to the current consensus, our monetary analysis continues to suggest that monetary restraint will slow both the economy and lower corporate earnings. Although our forecast calls for only a mild pause in real growth, we believe the odds of a more dramatic decline are uncomfortably high.
Closely monitoring inverted yield curves along with leading indicators such as housing and commodity prices will help provide an early guide to the next move in markets and the economy. We continue to expect stocks to decline due to overly optimistic expectations.

For more great content from Budget & Tax News.
For more from The Heartland Institute.


")

