


YOU SHOULD SUBSCRIBE TO CLIMATE CHANGE WEEKLY.
IN THIS ISSUE:
- Heat Waves Aren’t Becoming More Frequent
- Podcast of the Week: The Frozen Climate Views of the IPCC (Guest: Andy May)
- Deaths from Cold Temperatures Far Outnumber Heat-Related Deaths in Europe
- Neither Temperatures nor Mass Extinctions Are Driven by Carbon-Dioxide Levels
- Video of the Week: Hottest Day EVER? Not So Fast!
- BONUS Video of the Week: CLINTEL Exposes The Frozen Climate Views of the IPCC
- Climate Comedy
- Recommended Sites
Miss Anything at Heartland’s Climate Conference? No Problem.

Heat Waves Aren’t Becoming More Frequent
Editor’s Note: Since the beginning of July the mainstream media have been awash with stories claiming records are being set for high temperatures globally. Some stories have gone so far as to claim recent temperatures have been warmer than at any time in the past 125,000 years. Other, less ambitious claims are that the temperatures are the highest since the end of the ice age, or since a decent global temperature station system was established about 150 years ago.
These claims, however, are based on computer model re-analyses, not hard data, which, as my colleagues and I have shown repeatedly at Climate Realism—here, here, and here, for example—refute the claims of record-setting heat.
It is summer, and the heat is fierce in some locations. A single year’s hot weather does not a climate trend make, however. Recorded high temperatures in Phoenix and elsewhere in the western United States this year are a result of a combination of an El Niño and a heat dome lingering over the region, among other short-term atmospheric factors. My colleague, the award-winning meteorologist and Heartland Institute Senior Fellow Anthony Watts, uncovered dispositive data from the U.S. Environmental Protection Agency refuting claims that climate change is causing a worsening of heatwaves. His writing on this topic is presented below as a guest essay.
Media Chase ‘Climate Enhanced’ Heat Waves, Miss Data Showing They Are Less Frequent
A number of media outlets are claiming that U.S. heat waves are getting worse this week because of climate change. This is false. Actual data from temperature measurements show that heat waves in the U.S. are on the decline even as climate change has occurred over the last 75 years.
It is summer in the Northern Hemisphere, and unsurprisingly to those that pay attention to data, it is hot in many places in the U.S. In other words, it’s business as usual for summer. But the media sees climate change in every heat wave event and seeks to exploit a connection, even though there is none. For example, last week it was declared that the world had seen its hottest day ever on July 4, with some outlets claiming the “hottest in 100,000 years.” That of course, was proven laughably false at Climate Realism on both counts.
This week, the media were at it again. The Washington Post, in an article titled “Relentless heat wave reaching maximum strength: Weather updates,” says this: “What is a heat dome? Understand the science and how drought and climate change make them worse.”
Axios, in the article “What this summer’s weather reveals about climate change” written by the ever-excitable Andrew Freedman, opines,
Monitoring the planet’s climate this summer can give one the impression that the climate system—which includes the oceans, atmosphere, ice sheets and more—has gone off the rails. …
Climate studies have warned about an uptick in simultaneous heat waves occurring in the Northern Hemisphere.”
Then there is the “World Socialist Web Site” headline, “Record-breaking US heat wave demonstrates the growing dangers of climate change.”
None of the news outlets running heat wave stories this week examines or cites historical data on heat waves, preferring instead to push scary numbers in the form of heat indexes that combine temperature and humidity, reprint the opinion of “climate scientists,” and reference computer models that suggest climate change is making heat waves worse.
Yet, data exists for any reporter with a modicum of journalistic curiosity to find. The problem is that the data doesn’t look scary.
The U.S. Environmental Protection Agency (EPA) maintains a web page on heat waves in the U.S., which contains some very interesting data and maps. Despite the claims of climate change creating worse heat waves, the data the EPA has compiled going back to 1948 says exactly the opposite.
The data is on display in Figure 1, below.
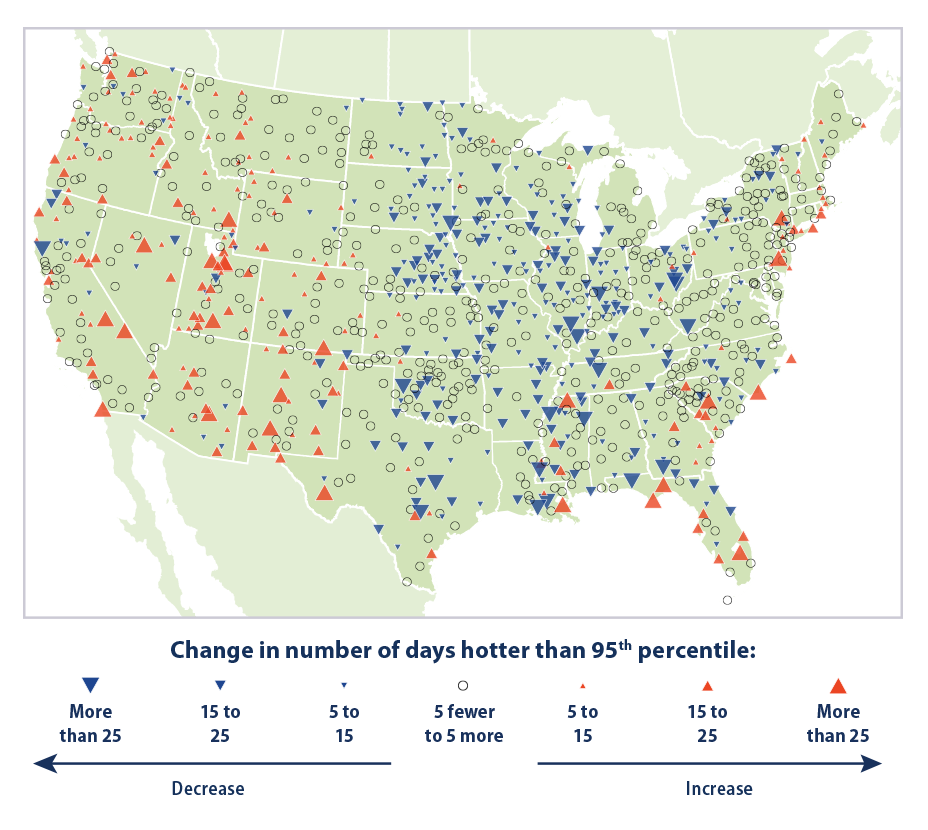
Figure 1: This map shows trends in unusually hot temperatures at individual weather stations that have operated consistently since 1948. In this case, the term “unusually hot” refers to a daily maximum temperature that is hotter than the 95th percentile temperature during the 1948–2020 period. Thus, the maximum temperature on a particular day at a particular station would be considered “unusually hot” if it falls within the warmest 5 percent of measurements at that station during the 1948–2020 period. The map shows changes in the total number of days per year that were hotter than the 95th percentile. Red upward-pointing symbols show where these unusually hot days are becoming more common. Blue downward-pointing symbols show where unusually hot days are becoming less common.
Data source: NOAA, 2021, EPA
The EPA writes:
The data come from thousands of weather stations across the United States. National patterns can be determined by dividing the country into a grid and examining the data for one station in each cell of the grid. This method ensures that the results are not biased toward regions that happen to have many stations close together. …
[Figure 1] was created by reviewing all daily maximum temperatures from 1948 to 2020 and identifying the 95th percentile temperature (a temperature that one would only expect to exceed in five days out of every 100) at each station. Next, for each year, the total number of days with maximum temperatures higher than the 95th percentile (that is, unusually hot days) was determined. The map shows how the total number of unusually hot days per year at each station has changed over time.
The EPA’s data for 1,066 weather stations across the United States showed a total of 863 stations, or 81 percent, reporting either a decrease or no change in the number of unusually hot days. By comparison, only 19 percent of all weather stations reported an increase in the number of unusually hot days since 1948.
Many of the stations showing hotter temperatures over the 1948-2020 period were located at airports or otherwise badly sited locations that created heat biases such as those reported by the study Climate Realism covered last year, Corrupted Climate Stations: The U.S. Temperature Record Remains Fatally Flawed. As reported in that study, much of the upward heat bias occurs in the minimum overnight temperature at these weather stations, enabling them to reach higher than expected daytime high temperatures had they not had a “head start” from the warmer than expected overnight low.
In fact, you can see this issue on display using maximum and minimum data for all weather stations in the United States. Figures 2A and 2B below show maximum and minimum temperatures in the United States from 1948, matching the start of EPA data in Figure 1.
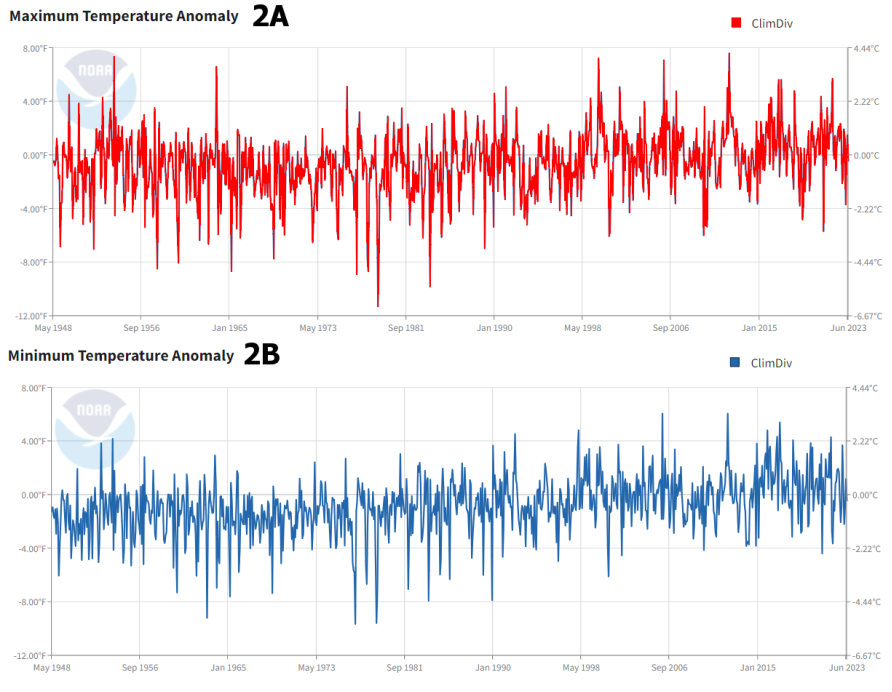
Figure 2A: Maximum temperatures in the U.S. from May 1948 to June 2023.
Figure 2B: Minimum temperatures in the U.S. from May 1948 to June 2023.
Source: NOAA National Temperature Index plotter. Note: color of the maximum temperature series in 2A has been changed to red from blue to delineate the two sets of data.
In figure 2A, you can see the maximum temperatures (the sort of temperatures that would occur in a heat wave) have not changed much since 1948. In fact, there are spikes of high temperatures in the United States in 1954 and in 1963 that are higher than the present day.
In figure 2B, you can see the minimum temperatures have had a slow and steady rise since 1948, with peaks in the last 20 years (warmer nights) being higher than values in the 1940s and 1950s.
Finally, another graph from the EPA shows that heat waves were actually the worst for the United States in the 1930s, well before climate change became a blip on the media radar. See Figure 3.
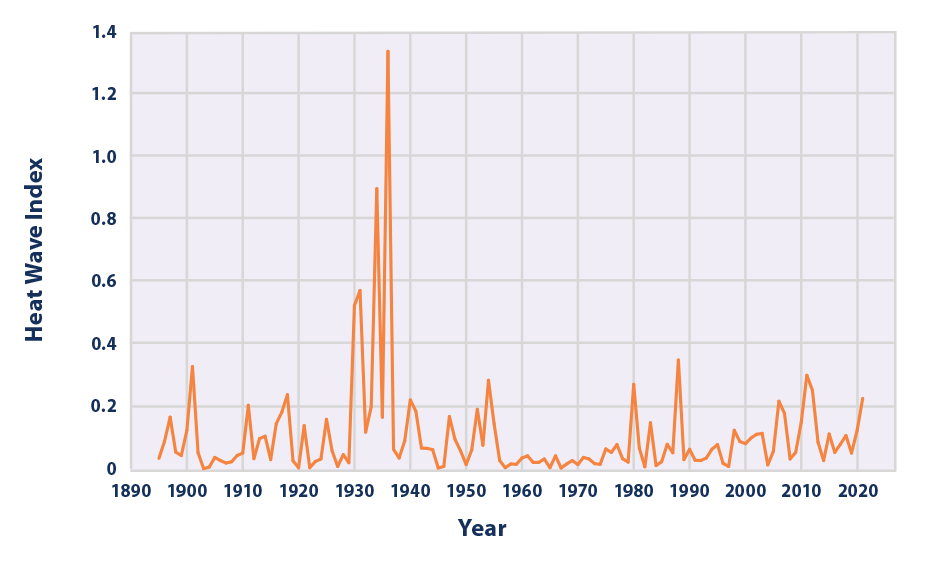
Figure 3. This figure shows the annual values of the U.S. Heat Wave Index from 1895 to 2021. These data cover the contiguous 48 states. An index value of 0.2 (for example) could mean that 20 percent of the country experienced one heat wave, 10 percent of the country experienced two heat waves, or some other combination of frequency and area resulted in this value.
Data source: Kunkel, 2022, EPA
The bottom line is this: despite what the media say, real-world data shows heat waves are not getting worse in the United States because of climate change. This flies in the face of opinions by climate scientists cited in the mainstream media, which seem wedded to the narrative that climate change is causing a crisis, despite data to the contrary.
- Anthony Watts
Source: Climate Realism
Get your Copy at Amazon TODAY!

Podcast of the Week
In its new critical review, the Climate Intelligence Foundation (CLINTEL) found many problems with the IPCC’s AR6 report on climate change. The IPCC made numerous false assumptions and flawed assessments, all the while ignoring key facts. The IPCC erred in its comparisons of present data with proxy data for past climate conditions, made flawed assumptions about climate sensitivity and emissions, and unjustifiably assumed nature plays almost no role in climate change. In addition, the IPCC ignored or downplayed the tremendous benefits to human life of present climate change.
Subscribe to the Environment & Climate News podcast on Apple Podcasts, iHeart, Spotify or wherever you get your podcasts. And be sure to leave a positive review!
Deaths from Cold Temperatures Far Outnumber Heat-Related Deaths in Europe

The Lancet Planetary Health recently published a study confirming what previous studies published in The Lancet and other peer-reviewed journals have shown: cold temperatures kill far more people than hot temperatures.
In this study, 21 researchers representing universities, research institutes, and government agencies in nine different countries examined death data in 854 urban areas across 30 European countries with 50,000 residents or more, broken down by age group, from 2000 through 2020.
The research team also extracted daily mean air temperatures for each of the 854 cities for the period 1990 through 2020. To control for factors which lead to special vulnerability, scholars searched a wide range of datasets and sources to account for “various socioeconomic, environmental, topographical, and infrastructural characteristics.”
Across the 30 countries, an average of approximately 203,620 premature deaths could be attributed to cold annually, about 7.01 percent of all deaths, the scientists found. An average of 20,173 deaths annually were caused by heat, approximately 0.69 percent of all deaths. So in the cities examined, more than 10 times as many people died from problems related to cold weather than from heat. Unsurprisingly, the research found the oldest people (72 to 91 years of age) made up the bulk of deaths related to either hot or cold temperatures.
This research confirmed three previously published Lancet studies comparing the incidences of deaths from cold weather and hot weather.
In a 2022 Lancet study, a team of 15 researchers at universities, research institutes, and government agencies in China and the United States concluded 593,000 premature deaths in China in 2019 were driven by nonoptimal temperatures. Approximately 580,000 of the premature deaths were caused by health factors impacted by cold temperatures, and approximately 13,000 were tied to warm temperatures. This means across China in 2019 approximately 46 times as many people died from such conditions as cardiovascular diseases and chronic respiratory diseases affected by nonoptimal cold temperatures than from deaths attributable to nonoptimal hot temperatures.
In 2021, The Lancet published what is arguably the largest study ever to examine excess mortality associated with temperature. The study’s authors—68 scientists representing universities and research institutes in 33 countries spanning all regions of the world—came to two very clear conclusions:
- Cold temperatures contribute to far more deaths each year than warmer temperatures.
- The annual number of deaths associated with extreme temperatures, hot or cold, is declining.
That study also found cold-related deaths were nearly 10 times more common than heat-related deaths, not eight times greater as claimed by the alarmist medical journals.
Previously published research in The Lancet, the Southern Medical Journal, and other outlets has consistently shown cold, not heat, is the biggest temperature-related killer and the number of deaths caused by extreme temperatures is falling dramatically as the Earth warms.
The new Lancet study is just one more arrow in the quiver taking down the shibboleth that climate change is causing an increase in temperature-related deaths.
Sources: The Lancet; Climate Realism
Heartland’s Must-read Climate Sites


Mass Extinctions Are Not Driven by Carbon-Dioxide Levels

A new study published in the American Geophysical Union’s peer-reviewed journal, Earth’s Future, found over hundreds of millions of years, neither increases nor decreases in carbon dioxide levels have caused mass extinctions.
In 2017, the author of the study, W. Jackson Davis, Ph.D., president and executive director of the Environmental Studies Institute and professor in the Division of Physical and Biological Sciences at the University of California, Santa Cruz, published a paper in the journal Climate examining the relationship between carbon dioxide levels and changes in temperatures over the past 425 million years. For more than 97 percent of the past 425 years, there was either a negative or no correlation between rises in temperatures and increases in atmospheric carbon dioxide, Davis found. Refuting the IPCC’s claim that carbon dioxide levels drive temperature changes, Davis found that for the vast majority of Earth’s history, carbon dioxide increases either lagged temperature changes or went in the opposite direction, or changes in one were not correlated with any changes in the other.
Davis’ new research examines the timing of mass extinctions in relation to atmospheric CO2 concentrations over the last 210 million years, during which time approximately 18 mass extinction events occurred. Davis found 12 mass extinction events occurred when CO2 was rising to or staying above 1,000 ppm for millions of years. Another six mass extinction events occurred during periods when atmospheric carbon dioxide levels were falling.
As in his 2017 paper, Davis found an overall negative correlation between global temperatures and atmospheric CO2 concentrations over the last 210 Mya. Specifically, proxy data indicates global average temperatures rose by multiple degrees on several occasions when carbon dioxide levels were falling precipitously. For instance, temperatures rose significantly once when CO2 fell from 772 parts per million (ppm) to 291 ppm.
When mass extinctions occurred during periods with high carbon dioxide levels, it seems something other than C02 was the driving factor: the extinctions occurred, on average, 4.08 million years after the CO2 levels had peaked.
Over the past 210 million years, the correlation between periods of global warming or periods of CO2-driven radiative forcing (RF) and extinction was “not discernibly different from zero,” Davis found. Davis concludes,
The present findings show that long-term (Myr) global temperature change, or climate, is not correlated discernibly with biodiversity loss during mass extinctions. … The absence of correlation demonstrates the absence of causality. This study therefore excludes long-term temperature (climate) change as a possible cause of past mass extinctions.
If long-term global warming was the cause of past extinctions, then long-term temperature and marginal RF by atmospheric CO2 should both be correlated positively with biodiversity loss. As shown here, however, biodiversity loss is not correlated discernibly with marginal RF by atmospheric CO2 … that is, changes in RF by atmospheric CO2 did not cause past collapses in biodiversity and are not a plausible kill mechanism of mass extinctions.
Sources: Earth’s Future; No Tricks Zone
Video of the Week
The media widely reported that the first week of July had the hottest temperatures in history. Well, that is if you consider history to be within a a lifetime or two. And where did they get their measurements? Linnea Lueken breaks it down in this video that went viral this week with more than 100,000 views!
Bonus Video of the Week
The International Panel on Climate Change’s (IPCC) sixth assessment report serves as the justification for many politicians to try and pass increasingly restrictive laws on society in the name of climate change. However, Andy May of the Climate Intelligence Foundation (CLINTEL) found many problems with the IPCC’s sixth assessment report. It made numerous false assumptions and flawed assessments, while ignoring facts and research that is should have considered in its report. May also found that The IPCC erred in its comparisons of present data with proxy data for past climate conditions, make flawed assumptions about climate sensitivity and emissions, and unjustifiably assumed nature plays not significant role in climate change.
In addition, the IPCC ignored or downplayed the tremendous benefits to human life of present climate change. May also found that the IPCC erred in its comparisons of present data with proxy data for past climate conditions, made flawed assumptions about climate sensitivity and emissions, and unjustifiably assumed nature does not play a significant role in climate change. In addition, the IPCC ignored or downplayed the tremendous benefits to human life of present climate change.
Andy May of CLINTEL joins host Anthony Watts and panelists H. Sterling Burnett and Linnea Lueken for this week’s episode of Climate Change Roundtable
Watch every episode of The Heartland Institute’s Climate Change Roundtable show LIVE every Friday at 1 p.m. CT.
Climate Comedy
 via Cartoons by Josh


")

